. 2011 Sep 23;222(2):279-88.
doi: 10.1016/j.bbr.2011.02.035. Epub 2011 Mar 23.

Horizontal biases in rats' use of three-dimensional space

Affiliations

Horizontal biases in rats' use of three-dimensional space

Aleksandar Jovalekic et al. Behav Brain Res. .

Abstract

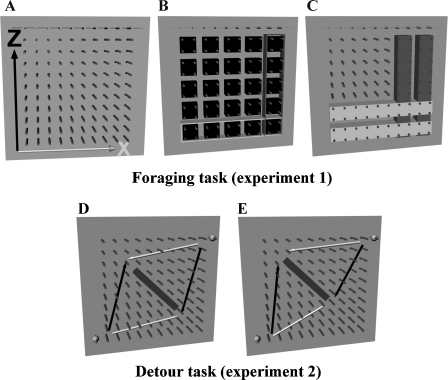
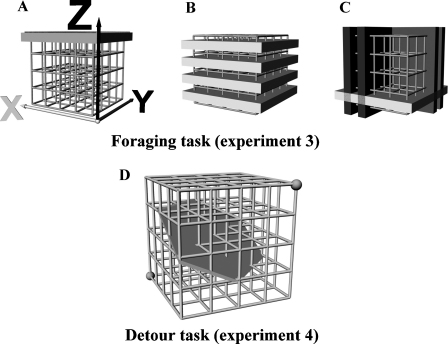
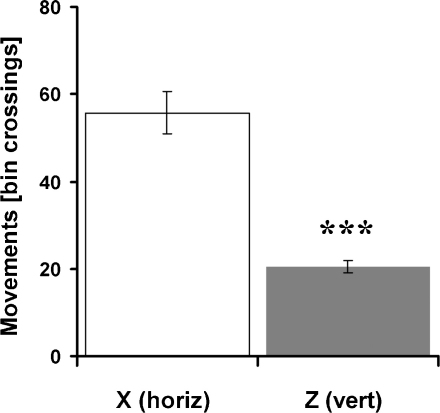
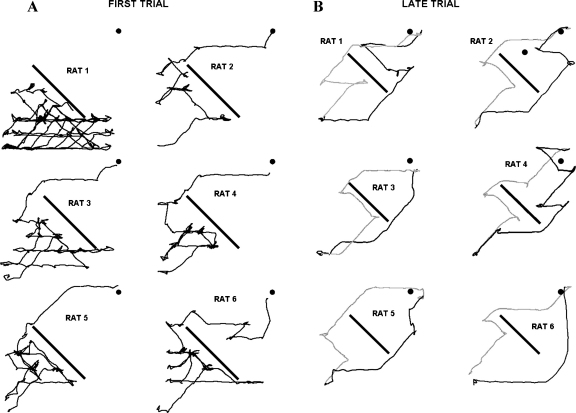
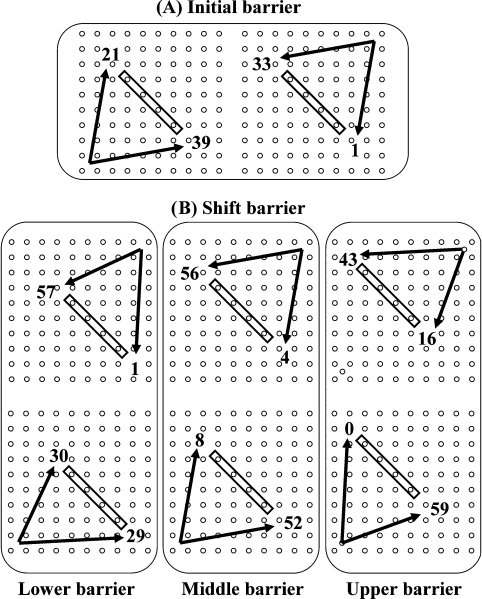
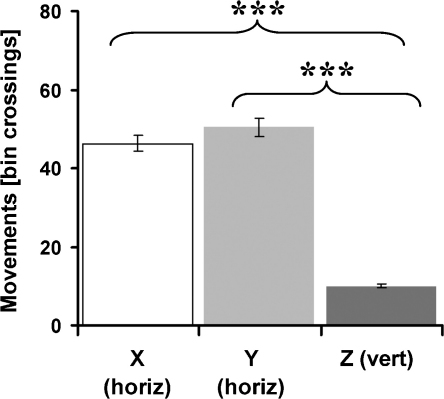
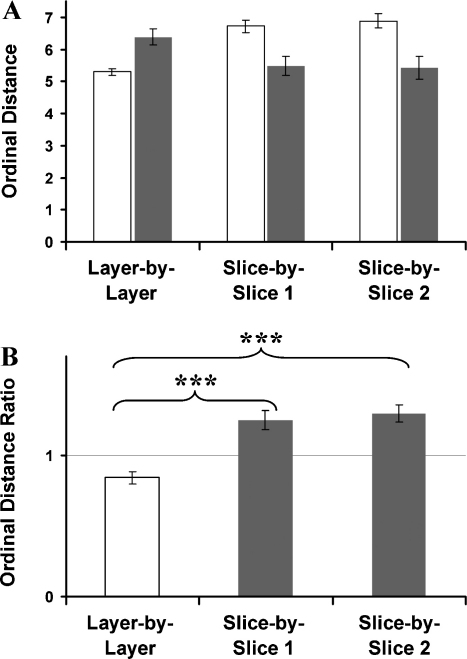
Rodent spatial cognition studies allow links to be made between neural and behavioural phenomena, and much is now known about the encoding and use of horizontal space. However, the real world is three dimensional, providing cognitive challenges that have yet to be explored. Motivated by neural findings suggesting weaker encoding of vertical than horizontal space, we examined whether rats show a similar behavioural anisotropy when distributing their time freely between vertical and horizontal movements. We found that in two- or three-dimensional environments with a vertical dimension, rats showed a prioritization of horizontal over vertical movements in both foraging and detour tasks. In the foraging tasks, the animals executed more horizontal than vertical movements and adopted a "layer strategy" in which food was collected from one horizontal level before moving to the next. In the detour tasks, rats preferred the routes that allowed them to execute the horizontal leg first. We suggest three possible reasons for this behavioural bias. First, as suggested by Grobety and Schenk, it allows minimisation of energy expenditure, inasmuch as costly vertical movements are minimised. Second, it may be a manifestation of the temporal discounting of effort, in which animals value delayed effort as less costly than immediate effort. Finally, it may be that at the neural level rats encode the vertical dimension less precisely, and thus prefer to bias their movements in the more accurately encoded horizontal dimension. We suggest that all three factors are related, and all play a part.


Figures

Fig. 1
Fig. 1
Schematic of the pegboard experiments (Experiments 1 and 2). (A–C) The foraging setup (Experiment 1), (D and E) the detour setup (Experiment 2). (A) The pegboard, a climbing wall with 100 pegs attached to a vertical wooden board (side length 121 cm × 121 cm). (B) 25 reward regions highlighted (black boxes), each region consisting of four pegs. One of the four pegs in each region was rewarded, with the reward peg changing randomly between trials. (C) Five horizontally adjacent regions form a layer (two layers shown in white) and five vertically adjacent regions form a column (two columns shown in grey). (D) The detour setup (Experiment 2). The pegboard is shown with 102 pegs attached, and the inserted barrier as it was initially positioned during detour testing. The 2 grey spheres indicate start and goal positions. The white arrows show the shallow-first legs of the two possible routes, both outward and return, and the black arrows show the steep-first legs. (E) Asymmetrically placed barrier.
Fig. 2
Fig. 2
Schematic of the lattice maze experiments. (A–C) The foraging setup (Experiment 3). (D) The detour setup (Experiment 4). (A) The lattice maze (side length 50 cm × 50 cm × 50 cm), a climbing cube constructed out of 64 smaller cubes. (B) The maze consists of 4 layers (white), each of the layers being baited at 6 positions, which varied randomly between trials. (C) Shown are examples of layers (white) and slices (grey and black), which were assigned for the layer-by-layer analysis and the slice-by-slice analysis. (D) The detour setup with inserted solid barrier.
Fig. 3
Fig. 3
Experiment 1—movement behaviours during foraging on the pegboard. Bin crossings in the horizontal (X) and vertical (Z) dimension. Pooled data: n = 8 rats, 10 days, 2 trials per day and rat.
Fig. 4
Fig. 4
Experiment 1—the ordinal distances in (A) and ordinal distance ratios in (B) of the foraging experiment on the pegboard. The ordinal distance analysis was undertaken to underpin regularities in the food retrieval pattern on a given trial. Ordinal distance ratios were calculated by dividing ordinal distances of rats with ordinal distances of optimised paths. Smaller values in the layer analysis indicate clustering of choices within layers and therefore indicate that animals would be biased towards adopting a layer strategy, and higher values would indicate that animals used a vertically biased strategy. Pooled data: n = 8 rats, 10 days, 2 trials per day and rat.
Fig. 5
Fig. 5
Experiment 2—path choices of all six animals on the pegboard during (A) first insertion of a symmetrical barrier and (B) representative paths of all animals during later trials. Upward paths are shown in black and downward paths in grey.
Fig. 6
Fig. 6
Experiment 2—pooled data of path choices on the pegboard during insertion of symmetrical and asymmetrical barriers. Results of the initial condition are shown in (A), whereby frequencies for shallow and steep paths are indicated for both upward and downward navigation. (B) The frequencies obtained during placement of an asymmetrical barrier. Pooled data: n = 6 rats, 10 trials per rat in initial and follow-up condition, 30 trials (10 lower, 10middle, 10 upper) per rat in asymmetrical condition.
Fig. 7
Fig. 7
Experiment 3—bin crossings in the horizontal (X and Y) and vertical (Z) dimension. Pooled data: n = 8 rats, 5 days, 2 trials per day and rat.
Fig. 8
Fig. 8
Experiment 3—(A) the ordinal distances of the foraging experiment on the lattice maze are shown for rat data (white) and optimised data (grey). (B) Ordinal distance ratios for the layer-by-layer analysis (white) and both slice-by-slice analysis (grey). The ordinal distance analysis was undertaken to underpin regularities in the food retrieval pattern on a given trial. Ordinal distance ratios were calculated by dividing ordinal distances of rats with ordinal distances of optimised paths. Smaller values in the layer analysis indicate clustering of choices within layers and therefore indicate that animals would be biased towards adopting a layer strategy, and higher values would indicate that animals used a vertically biased strategy. Pooled data: n = 8 rats, 5 days, 2 trials per day and rat.

References

    1. Bailenson J.N., Shum M.S., Uttal D.H. The initial segment strategy: a heuristic for route selection. Mem Cognit. 2000;28:306–318. - PubMed
    1. Buechner S., Hoelscher C., Strube G. Path choice heuristics for navigation related to mental representations of a building. In: Vosniadou S., Kayser D., Protopapas A., editors. Proceedings of the European Cognitive Science Conference. 2007. pp. 504–509.
    1. Calhoun J.B. Maryland; Bethesda: 1962. The ecology and sociology of the Norway rat.
    1. Christenfeld N. Choices from identical options. Psychol Sci. 1995;6:50–55.
    1. Grobety M.C., Schenk F. Spatial learning in a three-dimensional maze. Anim Behav. 1992;43:1011–1020.

Publication types