. 2011 Mar 25;34(3):435-47.
doi: 10.1016/j.immuni.2011.03.003.

Essential role for retinoic acid in the promotion of CD4(+) T cell effector responses via retinoic acid receptor alpha

Affiliations

Essential role for retinoic acid in the promotion of CD4(+) T cell effector responses via retinoic acid receptor alpha

Jason A Hall et al. Immunity. .

Abstract

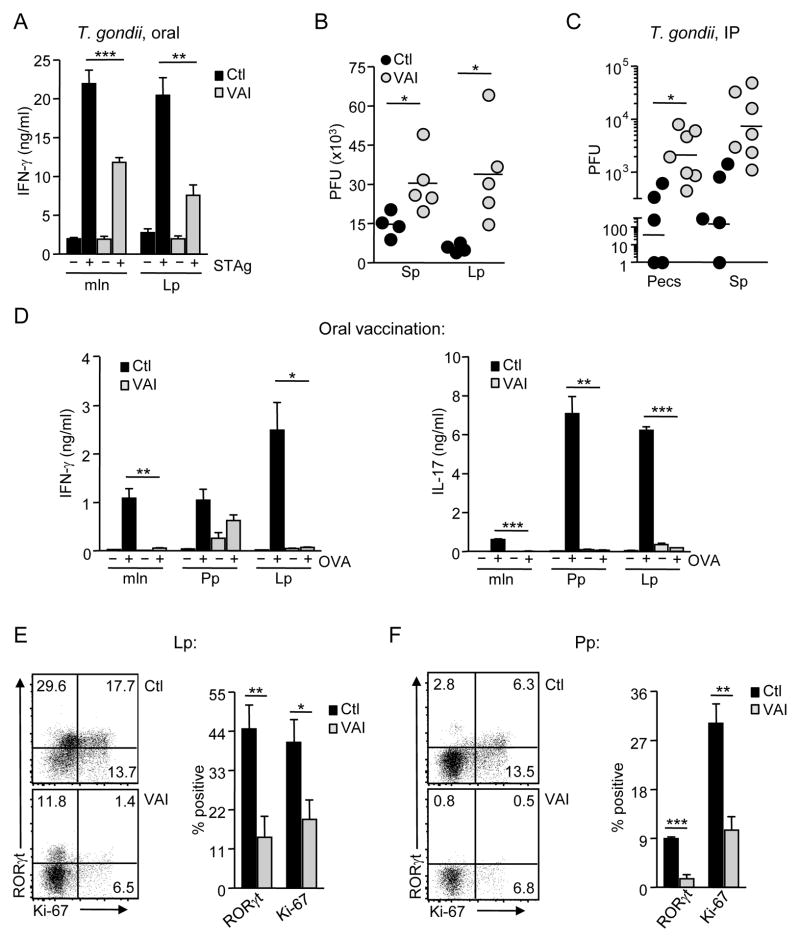
Vitamin A and its metabolite, retinoic acid (RA) are implicated in the regulation of immune homeostasis via the peripheral induction of regulatory T cells. Here we showed RA was also required to elicit proinflammatory CD4(+) helper T cell responses to infection and mucosal vaccination. Retinoic acid receptor alpha (RARα) was the critical mediator of these effects. Antagonism of RAR signaling and deficiency in RARα (Rara(-/-)) resulted in a cell-autonomous CD4(+) T cell activation defect, which impaired intermediate signaling events, including calcium mobilization. Altogether, these findings reveal a fundamental role for the RA-RARα axis in the development of both regulatory and inflammatory arms of adaptive immunity and establish nutritional status as a broad regulator of adaptive T cell responses.


Figures

Figure 1
Figure 1. Vitamin A metabolite dependent signaling is sustained and systemic during T. Gondii infection
(A) C57BL/6 mice were infected per-orally with 10 bradyzoite cysts of ME-49 clone C1. On day 8 post-infection (p.i.), single cell suspensions prepared from the spleen (Sp), mesenteric lymph nodes (mln) and small intestinal lamina propria (Lp), were stained with fluorochrome labeled antibodies and assessed for α4β7 and T-bet expression by flow cytometry. Dot plots are gated on Foxp3 CD44hi CD62Llo CD4+ T cells and representative of 3 mice per group. (B) C57BL/6 mice were infected intraperitoneally with 10 bradyzoite cysts of ME-49 clone C1. On day 8 p.i., single cell suspensions prepared from the Sp were stained and assessed as described in α4β7 and T-bet expression (C) Ctl and VAI mice were infected per-orally with T. gondii. On day 8 single cell suspensions were stained for α4β7. Bar graphs summarize the average frequency of Foxp3 CD44hi CD4+ T cells expressing α4β7, n = 3–4 mice per group. (D) Ctl and VAI mice were infected intraperitoneally with T. gondii and assessed as described in part C. n = 6–8 mice. For C and D, error bars illustrate the standard deviation (s.d.). Statistical comparisons were performed using the unpaired Student’s t test ***, P < 0.001, ns = not significant. Results are representative of 3 independent experiments.
Figure 2
Figure 2. TH-1 and TH-17 immune responses are impaired in the absence of vitamin A metabolites
(A–B) Ctl and VAI mice were infected per-orally with T. gondii (A) On day 8 p.i., pooled tissue suspensions were enriched for T cells and cultured with irradiated BMDC +/− soluble T. gondii antigen (STAg) for 48 hr. IFN-γ was measured in triplicate supernatants by ELISA. n = 4–5 mice per group. (B) Parasite burdens in Sp and Lp of individual mice were determined by plaque assay. Results are expressed as plaque forming units (PFU). Each dot represents an individual mouse (C) Ctl and VAI mice were infected intraperitoneally with T. gondii. Parasite burden was assessed day 8 p.i. n = 6–8 mice per group. (D–F) Ctl and VAI mice were immunized orally with a mixture of OVA and the mutant E. coli labile toxin, LT(R129G), once per week. On day 14, pooled cell suspensions from mln, Peyer’s patches (Pp) and Lp were cultured with BMDC infected with recombinant vaccinia virus expressing OVA (iDC) for 72 hours. Supernatant triplicates were assayed for IFN-γ and IL-17 by ELISA. n = 3–4 mice per group. (E-F) Lp (E) and Pp (F) suspensions from individual mice were assessed for intracellular RORγ(t) and Ki-67 by flow cytometry. Representative dot plots from Lp and Pp of WT and VAI mice gated on viable Foxp3 CD4+ T cells are shown. Bar graphs summarize the frequency of Ki-67+ and RORγ(t)+. Error bars in A and D depict the standard error of the mean (s.e.m); error bars in E and F depict the s.d. * P < 0.05; ** P < 0.01; *** P < 0.001.
Figure 3
Figure 3. Retinoic acid is required for CD4+ T cell immunity
(A–C) Ctl and VAI mice treated with RA or vehicle were infected orally with T. gondii and evaluated on day 8 p.i. n = 3 mice per group. (A) Pooled cell suspensions from Sp or Lp were enriched for T cells and cultured with irradiated BMDC +/- STAg for 48 hr. Bar graphs present the average amount of IFN-γ in duplicate or triplicate supernatants. (B) Lp samples were incubated for 14 hrs with STAg, and analyzed for intracellular IFN-γ via flow cytometry. Stacked histograms are gated on viable, Foxp3 CD4+ T cells. (C) Parasite burden in Sp and Lp of individual mice was measured by PFU. (D) Visualization of parasite localization in duodenal-jejunal sections of individual mice orally infected with T. gondii on day 9 p.i. (E–F) Ctl and VAI mice treated with RA or vehicle were immunized orally with a mixture of OVA and LT(R129G) on day 0 and 4. n = 3 mice per group. (E) On day 7, suspensions pooled from Lp were enriched for T cells and cultured with SpDC +/− OVA for 14 hr and examined for intracellular IL-17 and IFN-γ. Contour plots are gated on viable, Foxp3 CD4+ T cells. (F) Lp cells from individual mice were analyzed for intracellular RORγ(t) and Ki-67 by flow cytometry. Bar graphs depict Ki-67 and RORγt as a frequency of Foxp3 CD4+ T cells. (A-F), RA treated groups received 250μg RA intraperitoneally 5 days prior to infection or vaccine and every other day thence until takedown. Error bars in A depict the s.e.m. Error bars in C and F depict the s.d. * P < 0.05; ** P < 0.01; *** P < 0.001; ns = not significant. Results are representative of 2 (E-F) or 3 (A-D) independent experiments.
Figure 4
Figure 4. The RA/RARα signaling axis regulates CD4+ T cell immunity and homeostasis
(A) mRNA from sort-purified naïve CD4+ T cells (Foxp3 CD25 CD44lo) was assessed for Rara, Rarb and Rarg via quantitative RT-PCR and normalized to the housekeeping gene, hypoxanthine phosphoribosyltransferase. ND = not detected. (B) Rara/ and littermate control WT mice were immunized orally with a mixture of OVA and the mutant E. coli labile toxin, LT(R129G), once per week. On day 21, suspensions pooled from Sp were enriched for T cells and cultured with BMDC infected with recombinant vaccinia virus expressing OVA (iDC) for 72 hours. IFN-γ was quantified in triplicate supernatants. Results are representative of 2 independent experiments. (C) Lp cell suspensions from VAI, Rara/ and their respective control counterparts were assessed for Foxp3+ Treg via flow cytometry. Results are expressed as a proportion of viable TCRβ+ CD4+ T cells. (DE) Ctl, VAI and VAI DEREG mice immunized orally with a mixture of OVA and LT(R129G) on days 0 and 4 were treated with 1μg of diphtheria toxin 72 and 24 hrs prior to vaccination and every subsequent 48 hrs through termination of experiment. (D) On day 7, suspensions from individual mice were assessed for intracellular Foxp3 and Ki-67 by flow cytometry. Data are gated on CD4+ T cells. Each dot represents an individual mouse. (E) Suspensions pooled from the Lp were enriched for T cells and cultured with purified SpDC +/− OVA for 14 hr, then assessed for intracellular IL-17 and IFN-γ via flow cytometry. Contour plots are gated on viable Foxp3 CD4+ T cells. n = 3–4 mice per group (F) Summary of the absolute number of Foxp3+ and Foxp3 CD4+ T cells in the Lp of mice. (G) Vehicle or RA treated mice were orally infected with T. gondii or vaccinated as described in Figure 3. A summary of the frequency of Lp Treg ± s.d. as a proportion of viable CD4+ T cells is shown. n = 3 mice per group. Data are representative of 2–3 experiments. Error bars in A and B depict the s.d. ** P < 0.01; *** P < 0.001; ns = not significant.
Figure 5
Figure 5. Role of RARα signaling for T cell activation
(A) CD4+ CD62Lhi T cells purified from Sp and lymph nodes of Rara/ and littermate WT mice were activated with plate-bound α-CD3 + soluble α-CD28, in TH-1 or TH-17 polarizing conditions for 48 hrs. IFN-γ and IL-17 ± s.e.m. in culture supernatants were measured by ELISA. ***, P < 0.001 (B) CD4+ T cells were plated for 48 hrs in the following conditions: I. unstimulated II. α-CD3 III. α-CD3 + α-CD28 IV. α-CD3 + α-CD28 + IL-2. After 48 hrs, cells were rested overnight in IL-2 and assayed for CFSE intensity by flow cytometric analysis. Histograms are gated on viable CD4+ T cells. (C-D) CD4+ CD62Lhi T cells were isolated and activated for 16 hrs. (C) Assessment of CD69, CD25, and CD71. Shaded histograms = unstimulated, black lines = stimulated with α-CD3 + α-CD28 + IL-2. Numbers indicate the mean fluorescence intensity. (D) Assessment of phosphorylated ribosomal protein S6 (pS6) in: I. unstimulated II. α-CD3 IV. α-CD3 + α-CD28 + IL-2 conditions (E) CD4+ T cells (5x10⁶) were stimulated with plate-bound α-CD3 (2μg/ml) and/or α-CD28 (10μg/ml) for the indicated times and then lysed. Total cell lysates were immunoblotted for phosphorylated (Ser473) and total Akt.
Figure 6
Figure 6. Loss of basal RARα signaling impairs responsiveness to TCR/CD3 engagement
(A-C) CD4+ T cells (7x10⁶) were stimulated with plate-bound α-CD3 (2μg/ml) for the indicated times and then lysed. (A) Total cell lysates (TCL) were immunoblotted for phosphorylated (Y493) and total ZAP-70. (B) PLC-γ1 was immunoprecipitated from TCL. Tyrosine phosphorylation was assessed by immunoblotting with 4G10. ERK1/2 activation was evaluated from TCL. (C-E) Ca2+ mobilization, cells are gated on total CD4+ T cells. (C) Rara/ (grey line), and WT mice (black line). (D-E) Vehicle treated (black line) versus LE540 (dashed line, 2.5mM) treated cells. Histograms depict the median ratio of DAPI-A/Indo-1-A of Ca2+ fluxing cells as a function of time (seconds). (C-D) Addition of biotinylated α-CD3 (10μg/ml) (1) and crosslinking, streptavidin (20mg/ml) (2). (E) Black arrow denotes addition of ionomycin (iono).

Comment in

References

    1. Balagopalan L, Coussens NP, Sherman E, Samelson LE, Sommers CL. The LAT story: a tale of cooperativity, coordination, and choreography. Cold Spring Harb Perspect Biol. 2:a005512. - PMC - PubMed
    1. Benson MJ, Pino-Lagos K, Rosemblatt M, Noelle RJ. All-trans retinoic acid mediates enhanced T reg cell growth, differentiation, and gut homing in the face of high levels of co-stimulation. J Exp Med. 2007;204:1765–1774. - PMC - PubMed
    1. Biesalski HK, Nohr D. New aspects in vitamin a metabolism: the role of retinyl esters as systemic and local sources for retinol in mucous epithelia. J Nutr. 2004;134:3453S–3457S. - PubMed
    1. Cantorna MT, Nashold FE, Hayes CE. In vitamin A deficiency multiple mechanisms establish a regulatory T helper cell imbalance with excess Th1 and insufficient Th2 function. J Immunol. 1994;152:1515–1522. - PubMed
    1. Carman JA, Pond L, Nashold F, Wassom DL, Hayes CE. Immunity to Trichinella spiralis infection in vitamin A-deficient mice. J Exp Med. 1992;175:111–120. - PMC - PubMed

Publication types