

doi: 10.1016/j.tics.2011.02.002.
Epub 2011 Mar 21.
Posterior cingulate cortex: adapting behavior to a changing world
Affiliations
- PMID: 21420893
- PMCID: PMC3070780
- DOI: 10.1016/j.tics.2011.02.002
Item in Clipboard
Posterior cingulate cortex: adapting behavior to a changing world
Trends Cogn Sci.
2011 Apr.
Abstract
When has the world changed enough to warrant a new approach? The answer depends on current needs, behavioral flexibility and prior knowledge about the environment. Formal approaches solve the problem by integrating the recent history of rewards, errors, uncertainty and context via Bayesian inference to detect changes in the world and alter behavioral policy. Neuronal activity in posterior cingulate cortex - a key node in the default network - is known to vary with learning, memory, reward and task engagement. We propose that these modulations reflect the underlying process of change detection and motivate subsequent shifts in behavior.
Copyright © 2011 Elsevier Ltd. All rights reserved.
Figures
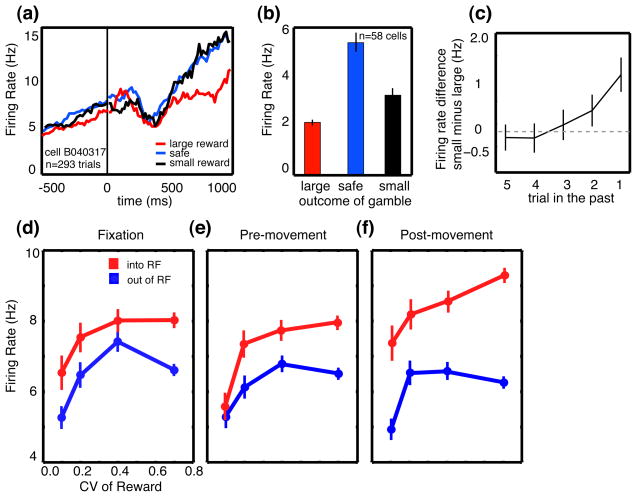
CGp encodes reward outcomes over multiple trials and predicts changes in strategy. (a) PSTH for example neuron following reward delivery when monkeys choose between variably rewarded outcomes and deterministically rewarded outcomes with the same mean reward rate. Firing rates were significantly greater following small or medium rewards than following large rewards. (b) Bar graph showing the average firing of all neurons in the population following delivery of large, medium, and small rewards. Firing rates are averaged over a 1s epoch beginning at the time of reward offset (t=0). Tick marks indicate one standard error. (c) Average effect of reward outcome on neuronal activity up to five trials in the future. Bars indicate one standard error. (d–f) Average neuronal firing rates as a function of coefficient of variation (CV) in reward size plotted for 3 trial epochs in the probabilistic reward task. Firing increased for saccades into the neuronal response field (RF), and was positively correlated with reward CV (standard deviation/mean). Bars represent s.e.m. Adapted from [38] and [32].
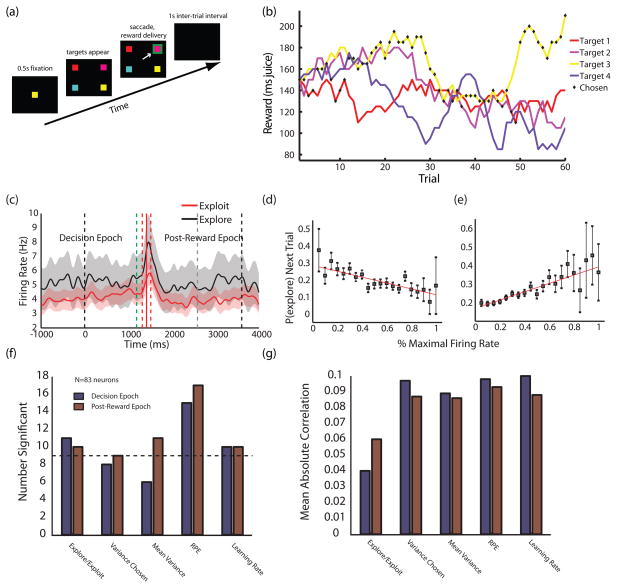
CGp neurons encode variance/learning rate and change probability in a volatile environment. (a) Schematic of the four-armed bandit task. Four targets appear each trial, each baited with an independently varying juice reward. (b) Sample payouts and choices for the four options over a single block. Reward values for each target independently follow a random walk process. Black diamonds indicate the monkey’s choices during the given block. (c) PSTH for example neuron in the 4-armed bandit task, showing significant differences in firing for exploratory and exploitative strategies in both the decision and evaluation epochs. Exploit trials are in red, explore trials in black. The task begins at time 0. Onset of the “go” cue (dashed green line), reward delivery (solid red line), beginning of intertrial interval (dashed gray line), and end of trial (rightmost dashed black line) are mean times. Dashed red lines indicate ± one standard deviation in reward onset. Shaded areas represent s.e.m. of firing rates. (d,e) Neurons in CGp encode probability of exploring on the next trial. Points are probabilities of exploring next trial as a function of percent maximal firing rate in the decision epoch, averaged separately over negatively- and positively-tuned populations of neurons (d and e, respectively). (f) Numbers of neurons encoding relevant variables in a Kalman filter learning model of behavior [8, 39]. Bars indicate numbers of significant partial correlation coefficients for each variable with mean firing rate in each epoch when controlling for others. The decision epoch (blue) lasted from trial onset to target selection; the post-reward epoch (red) lasted from the end of reward delivery to the end of the inter-trial interval. Dotted line indicates a statistically significant population of neurons, assuming a p=0.05 false positive rate. Variance chosen indicates the estimated variance in the value of the chosen option. Mean variance indicates the mean of this quantity across all options. (g) Mean absolute partial correlation coefficients for significant cells. Colors are as in (f). Adapted from [39].
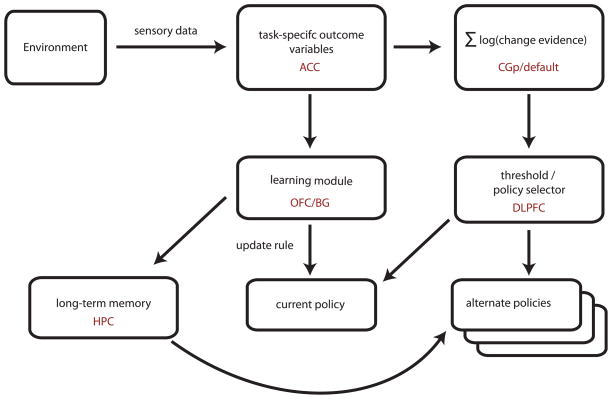
A simplified schematic of change detection and policy selection. Sensory feedback from reward outcomes is divided into task-specific variables and passed on to both a reinforcement learning module and a change detector. The learning module computes an update rule based on the difference between expectations and outcomes in the current world model, and updates the policy accordingly. The change detector calculates an integrated log probability that the environment has undergone a change to a new state. If this variable exceeds a threshold, the policy selection mechanism substitutes a new behavioral policy, which will be updated according to subsequent reward outcomes.
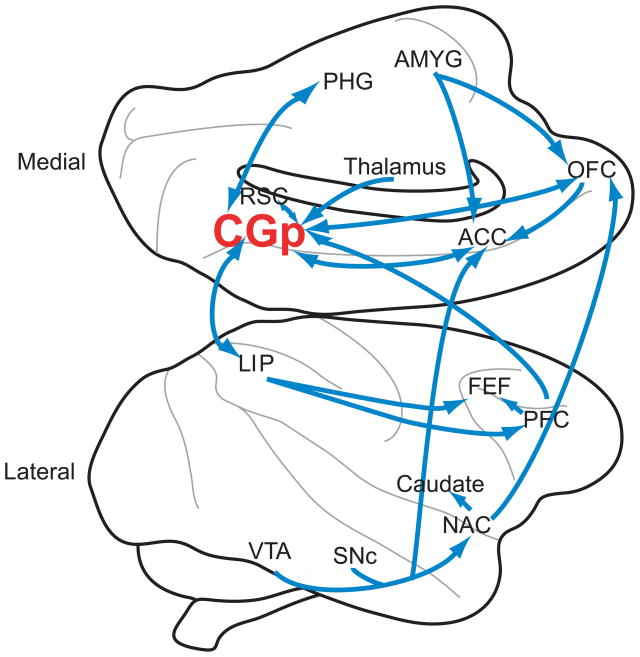
Figure shows medial (top) and lateral (bottom) views of the macaque brain. Significant neuroanatomical connections to and from CGp are shown. Note that the figure does not represent a thorough diagramming of innervations, as CGp connects to a large number of brain regions. Generally, CGp neuroanatomy is similar in humans and macaques [73]. Abbreviations: VTA=ventral tegmental area; SNc=Substantia nigra pars compacta; NAC=nucleus accumbens; PFC=prefrontal cortex; FEF=frontal eye field; LIP=lateral intraparietal area; CGp=posterior cingulate cortex; ACC=anterior cingulate cortex; RSC=retrosplenial cortex; PHG=parahippocampal gyrus; OFC=orbitofrontal cortex; AMYG=amygdala
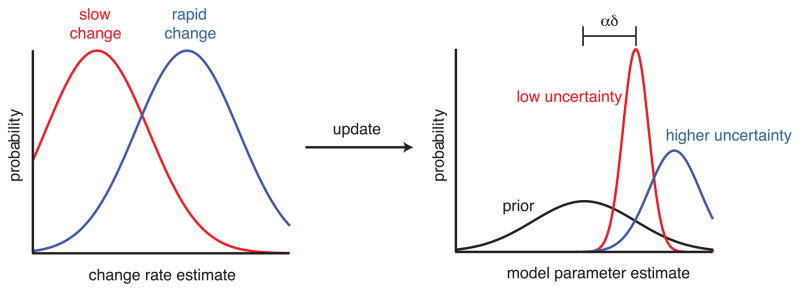
Bayesian update rules for learning. Model parameters are initially estimated as prior distributions (black). When outcomes are observed, distribution means are shifted by the product of learning rate, α, and prediction error, δ, while variances change based on the estimated rate of environmental change (left). When the estimated rate of environmental change is low (red), both mean updates and uncertainty (proportional to variance) are likewise small. When change is rapid (blue), means are updated rapidly, but uncertainty remains high.
References
-
- Nakahara K, et al. Functional MRI of macaque monkeys performing a cognitive set-shifting task. Science. 2002;295:1532–1536. - PubMed
-
- Gusnard DA, Raichle ME. Searching for a baseline: Functional imaging and the resting human brain. Nature Reviews Neuroscience. 2001;2:685–694. - PubMed
-
- Schultz W. Behavioral dopamine signals. Trends in Neurosciences. 2007;30:203–210. - PubMed
-
- Sutton RS, Barto AG. Reinforcement Learning: An Introduction. MIT Press; 1998.
Publication types
MeSH terms
Grants and funding
LinkOut - more resources
Full Text Sources
