. 2011 Aug;122(8):1549-55.
doi: 10.1016/j.clinph.2011.01.041. Epub 2011 Mar 21.

A postsleep decline in auditory evoked potential amplitude reflects sleep homeostasis

Affiliations

A postsleep decline in auditory evoked potential amplitude reflects sleep homeostasis

Brad K Hulse et al. Clin Neurophysiol. 2011 Aug.

Abstract

Objective: It has been hypothesized that slow wave activity, a well established measure of sleep homeostasis that increases after waking and decreases after sleep, may reflect changes in cortical synaptic strength. If so, the amplitude of sensory evoked responses should also vary as a function of time awake and asleep in a way that reflects sleep homeostasis.

Methods: Using 256-channel, high-density electroencephalography (EEG) in 12 subjects, auditory evoked potentials (AEP) and spontaneous waking data were collected during wakefulness before and after sleep.

Results: The amplitudes of the N1 and P2 waves of the AEP were reduced after a night of sleep. In addition, the decline in N1 amplitude correlated with low-frequency EEG power during non-rapid eye movement sleep and spontaneous wakefulness, both homeostatically regulated measures of sleep need.

Conclusions: The decline in AEP amplitude after a night of sleep may reflect a homeostatic reduction in synaptic strength.

Significance: These findings provide further evidence for a connection between synaptic plasticity and sleep homeostasis.


Conflict of interest statement

The other authors have indicated no financial conflicts of interest.

Figures

Figure 1
Figure 1
Decline in the amplitude of the N1 and P2 waves of the AEP after sleep. (A) Average AEP across subjects for presleep (blue) and postsleep (red) conditions. Tone presented at time 0. Black bars mark samples showing significant differences between pre- and postsleep conditions using a STCT. (B) Same as in A for average GMFP. (C) Instantaneous voltage distribution displayed topographically for N1 (top row) and P2 (bottom row) in the presleep (left column) and postsleep (middle column) conditions averaged across subjects. AEP amplitude was normalized by the average amplitude over both conditions and all channels. Values at each channel (dots) were color code and plotted at their corresponding position on the planer projection of the scalp surface. Right column, pre- to postsleep change in amplitude. Difference calculated as the absolute value of the presleep amplitude subtracted from the absolute value of the postsleep amplitude. White dots mark channels with significant pre- to postsleep differences using a STCT (Nichols and Holmes, 2001).
Figure 2
Figure 2
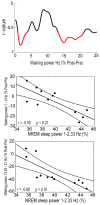
Correlation between the decline in N1 GMFP amplitude after sleep and power during sleep and wakefulness. (A) Top, correlation between the decline in the N1 amplitude after sleep and power during NREM sleep by frequency bin, averaged across channels. Significant frequency bins are marked in red. Bottom, scatter plot showing the correlation between the decline in the N1 amplitude and NREM sleep power between 1 and 2.33 Hz. (B) Correlation between the decline in N1 amplitude after sleep and the pre- to postsleep change in spontaneous waking power between 2–5 Hz (top) and 17–24 Hz (bottom). Left, r-values plotted topographically. White dots mark channels showing significant correlations (top, STCT; bottom, uncorrected for multiple comparisons). Right, scatter plot, power average across channels showing a significant correlation. Pre- to postsleep differences calculated as postsleep values subtracted from presleep values. The decline in N1 GMFP amplitude was expressed as the percent difference from the mean (postsleep minus presleep). For normalization of waking power, see methods.
Figure 3
Figure 3
Correlation between NREM sleep power and the pre- to postsleep change in spontaneous waking power. Top, correlation between NREM sleep power in the 1–2.33 Hz band and the change in spontaneous waking power after sleep by frequency bin averaged across channels (postsleep minus presleep). Significant bins are marked in red. Middle, scatter plot of NREM sleep power (1–2.33 Hz) and the percent change in spontaneous waking power (1–4 Hz). Bottom, scatter plot of NREM sleep power (1–2.33 Hz) and the percent change in spontaneous waking power (13.25–21 Hz).

Similar articles

Cited by

References

    1. Aeschbach D, Matthews JR, Postolache TT, Jackson MA, Giesen HA, Wehr TA. Two circadian rhythms in the human electroencephalogram during wakefulness. Am J Physiol. 1999;227(6 Pt 2):R1771–9. - PubMed
    1. Amzica F, Steriade M. Electrophysiological correlates of sleep delta waves. Electroenceph Clin Neurophysiol. 1998;107(2):69–83. - PubMed
    1. Baumann S, Meyer M, Jäncke L. Enhancement of Auditory-evoked Potentials in Musicians Reflects an Influence of Expertise but not Selective Attention. J Cogn Neurosci. 2008;20(12):2238–49. - PubMed
    1. Borbély AA. A Two Process Model of Sleep Regulation. Hum Neurobiol. 1982;1(3):195–204. - PubMed
    1. Cajochen C, Wyatt JK, Czeisler CA, Dijk DJ. Separation of Circadian and Wake Duration-Dependent Modulation of EEG Activation During Wakefulness. Neuroscience. 2002;114(4):1047–60. - PubMed

Publication types