

Effects of 34 risk loci for type 2 diabetes or hyperglycemia on lipoprotein subclasses and their composition in 6,580 nondiabetic Finnish men
- PMID: 21421807
- PMCID: PMC3292337
- DOI: 10.2337/db10-1655
Effects of 34 risk loci for type 2 diabetes or hyperglycemia on lipoprotein subclasses and their composition in 6,580 nondiabetic Finnish men
Abstract
Objective: We investigated the effects of 34 genetic risk variants for hyperglycemia/type 2 diabetes on lipoprotein subclasses and particle composition in a large population-based cohort.
Research design and methods: The study included 6,580 nondiabetic Finnish men from the population-based Metabolic Syndrome in Men (METSIM) study (aged 57 ± 7 years; BMI 26.8 ± 3.7 kg/m(2)). Genotyping of 34 single nucleotide polymorphism (SNPs) for hyperglycemia/type 2 diabetes was performed. Proton nuclear magnetic resonance spectroscopy was used to measure particle concentrations of 14 lipoprotein subclasses and their composition in native serum samples.
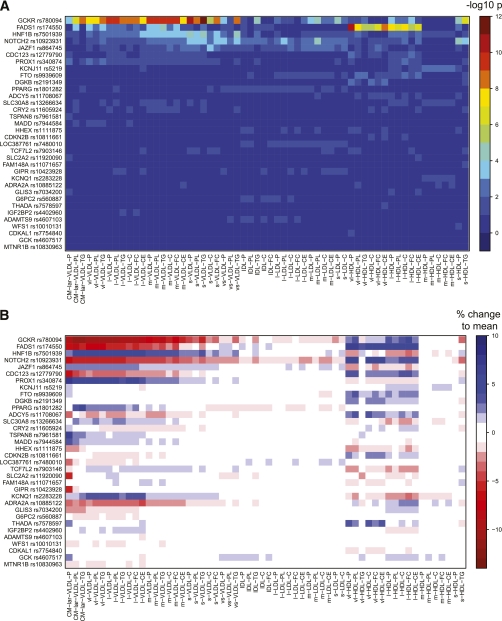
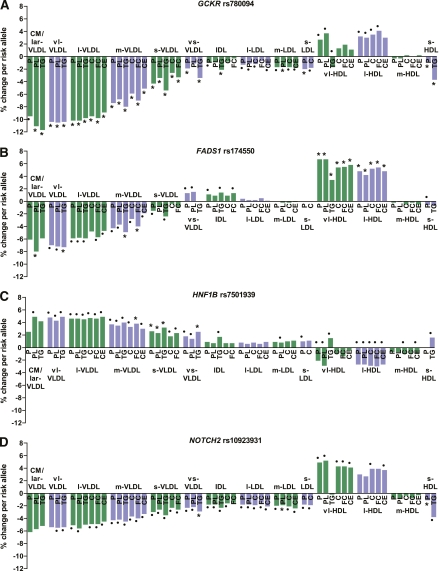
Results: The glucose-increasing allele of rs780094 in GCKR was significantly associated with low concentrations of VLDL particles (independently of their size) and small LDL and was nominally associated with low concentrations of intermediate-density lipoprotein, all LDL subclasses, and high concentrations of very large and large HDL particles. The glucose-increasing allele of rs174550 in FADS1 was significantly associated with high concentrations of very large and large HDL particles and nominally associated with low concentrations of all VLDL particles. SNPs rs10923931 in NOTCH2 and rs757210 in HNF1B genes showed nominal or significant associations with several lipoprotein traits. The genetic risk score of 34 SNPs was not associated with any of the lipoprotein subclasses.
Conclusions: Four of the 34 risk loci for type 2 diabetes or hyperglycemia (GCKR, FADS1, NOTCH2, and HNF1B) were significantly associated with lipoprotein traits. A GCKR variant predominantly affected the concentration of VLDL, and the FADS1 variant affected very large and large HDL particles. Only a limited number of risk loci for hyperglycemia/type 2 diabetes significantly affect lipoprotein metabolism.
Figures
References
-
- Zhang L, Qiao Q, Tuomilehto J, et al. ; DECODE Study Group Blood lipid levels in relation to glucose status in European men and women without a prior history of diabetes: the DECODE Study. Diabetes Res Clin Pract 2008;82:364–377 - PubMed
-
- Mooradian AD. Dyslipidemia in type 2 diabetes mellitus. Nat Clin Pract Endocrinol Metab 2009;5:150–159 - PubMed
-
- Wilson PW, Meigs JB, Sullivan L, Fox CS, Nathan DM, D’Agostino RB., Sr Prediction of incident diabetes mellitus in middle-aged adults: the Framingham Offspring Study. Arch Intern Med 2007;167:1068–1074 - PubMed
Publication types
MeSH terms
Substances
Grants and funding
LinkOut - more resources
Full Text Sources
Medical
Molecular Biology Databases
Miscellaneous
