. 2011 Nov;21(11):2498-506.
doi: 10.1093/cercor/bhr035. Epub 2011 Mar 21.

A pure salience response in posterior parietal cortex

Affiliations

A pure salience response in posterior parietal cortex

Fabrice Arcizet et al. Cereb Cortex. 2011 Nov.

Abstract

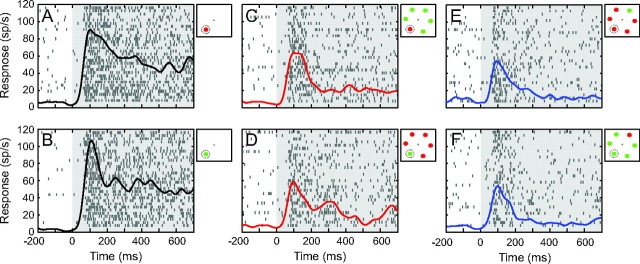
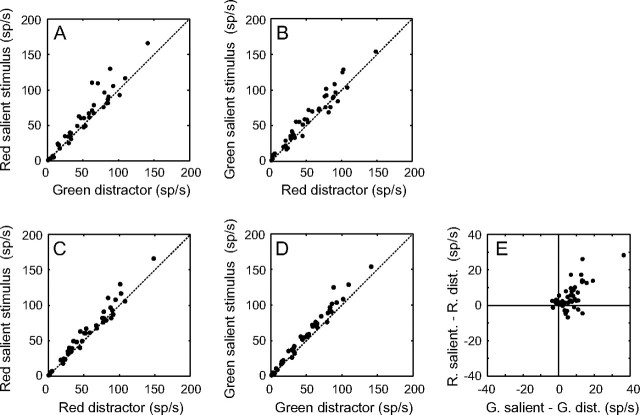
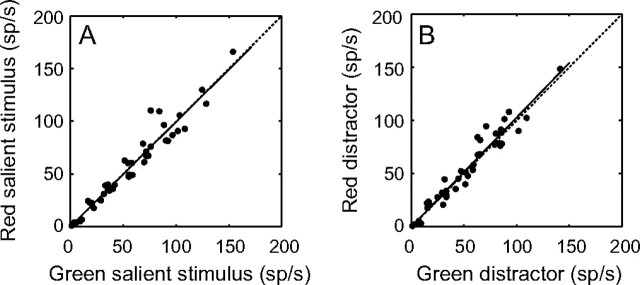
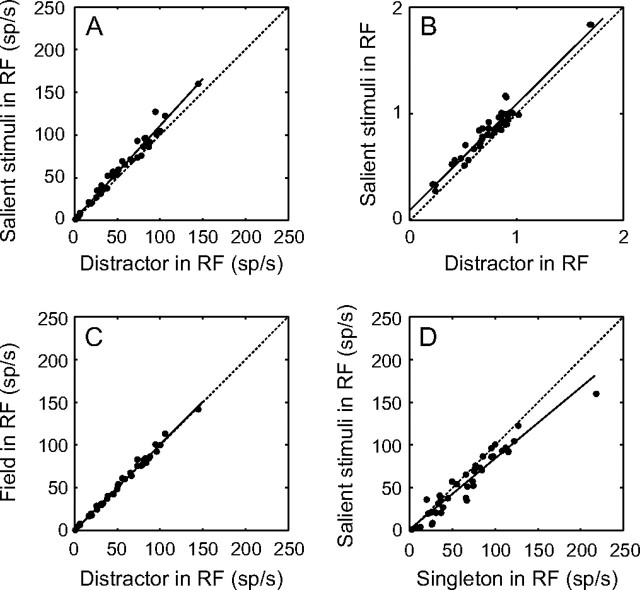
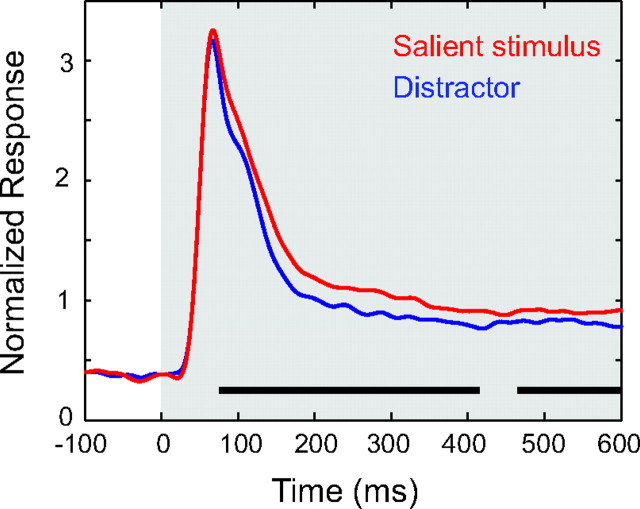
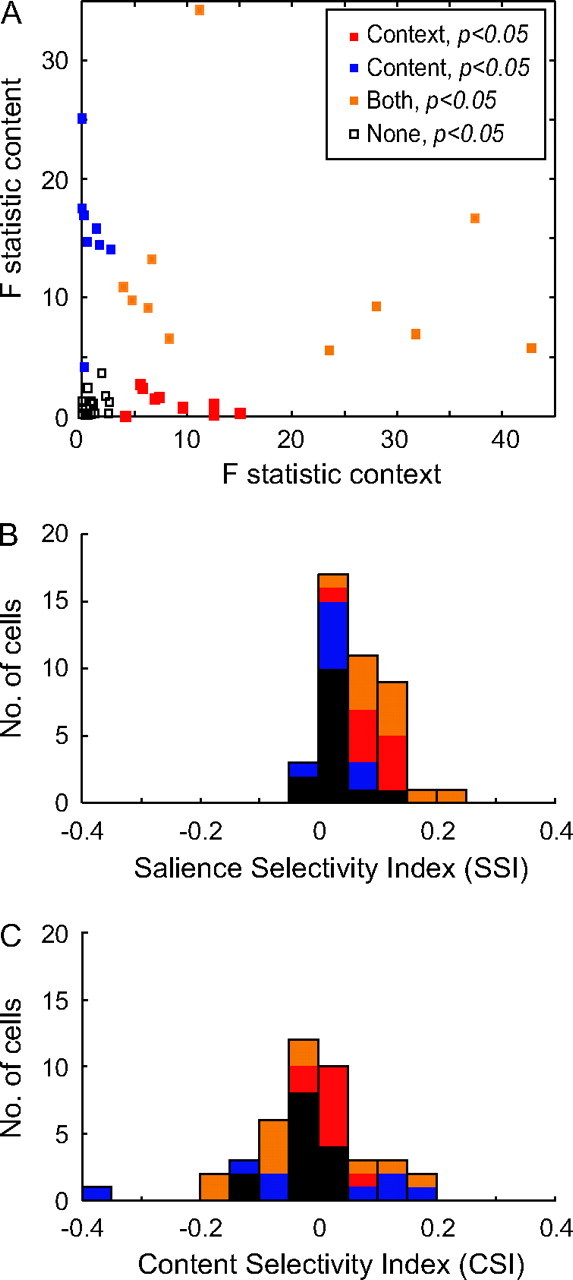
When exploring a visual scene, some objects perceptually popout because of a difference of color, shape, or size. This bottom-up information is an important part of many models describing the allocation of visual attention. It has been hypothesized that the lateral intraparietal area (LIP) acts as a "priority map," integrating bottom-up and top-down information to guide the allocation of attention. Despite a large literature describing top-down influences in LIP, the presence of a pure salience response to a salient stimulus defined by its static features alone has not been reported. We compared LIP responses with colored salient stimuli and distractors in a passive fixation task. Many LIP neurons responded preferentially to 1 of the 2 colored stimuli, yet the mean responses to the salient stimuli were significantly higher than to distractors, independent of the features of the stimuli. These enhanced responses were significant within 75 ms, and the mean responses to salient and distractor stimuli were tightly correlated, suggesting a simple gain control. We propose that a pure salience signal rapidly appears in LIP by collating salience signals from earlier visual areas. This contributes to the creation of a priority map, which is used to guide attention and saccades.


Figures

Figure 1.
Figure 1.
Responses of an example LIP neuron. Each panel shows the spike density function and raster plots of spike times aligned on stimulus presentation for different configurations of stimuli; singleton condition (A and B), salient condition (C and D), and distractor condition (E and F). Gray rectangles represent the time of stimulus presentation, and all the trials are aligned to the onset of the stimuli. The array configurations are represented in the upper right region of each panel. Dotted circle symbolizes the RF of the neuron.
Figure 2.
Figure 2.
Responses to salient stimuli compared with distractors. (A) Mean responses of the 42 LIP neurons when the red salient stimulus is present in the RF are plotted against the mean responses to green distractors in RF. (B) Mean responses to green salient stimuli in the RF are plotted against the mean responses to red distractors in the RF. (C) Mean responses to the red salient stimuli in the RF are plotted against the mean responses to red distractors in the RF. (D) Mean responses to green salient stimuli in the RF are plotted against the mean responses to green distractors in the RF. (E) Differences of mean responses to red salient stimuli and red distractors in the RF are plotted as a function of the differences of the mean responses to green salient stimuli and green distractors in the RF. Activity was calculated as the average firing rate from a 350-ms period starting 50 ms after stimulus onset. In AD, dotted lines represent unity lines.
Figure 3.
Figure 3.
Responses to red stimuli compared with green. (A) Mean responses to red salient stimuli in the RF are plotted against the mean responses to green salient stimuli in the RF. A linear regression of the data showed an intercept of 0.24 (±5.75) sp/s and a slope of 0.99 (±0.08). (B) Mean responses to red distractors in the RF are plotted against the mean responses to green distractors in the RF. A linear regression of these data showed that the intercept was very close to 0 (−0.004 ± 4.92 sp/s), and the slope was essentially 1 (1.03 ± 0.08). Dotted lines represent unity lines, solid lines show lines of best fit using linear regression.
Figure 4.
Figure 4.
Mean responses to different stimulus contexts. (A) Mean responses of the 42 LIP neurons to salient stimuli compared with the mean responses to distractors. (B) Mean normalized responses of the 40 LIP neurons that were recorded in the singleton condition to salient stimuli compared with the mean normalized responses to distractors. (C) Mean responses in the field condition are plotted against mean responses to distractors. (D) Mean responses to salient stimuli are plotted against the mean responses to the singleton stimuli. Activity was calculated as the average firing rate from a 350-ms period starting 50 ms after stimulus onset. Dotted lines represent unity lines, solid lines show lines of best fit using linear regression.
Figure 5.
Figure 5.
Time of discrimination. Mean normalized population spike density functions when a salient stimulus (red curve) or distractor (blue curve) was presented in the RF. Gray rectangle represents the time of stimulus presentation. Black horizontal lines indicate when the separation is significant (P < 0.05, paired t-tests on 50-ms overlapping bins, with 10-ms steps).
Figure 6.
Figure 6.
ANOVA and selectivity indices. (A) F statistics from ANOVA for main factor content are plotted against F statistics from ANOVA for context. Each dot represents the F statistic of one LIP neuron. Colors indicate whether the effects were significant. (B) Distribution histogram of the SSI computed on the neural population (n = 42). Colors as in A. (C) Distribution histogram of the CSI. Colors as in A.

References

    1. Arcizet F, Jouffrais C, Girard P. Natural textures classification in area V4 of the macaque monkey. Exp Brain Res. 2008;189:109–120. - PubMed
    1. Armstrong KM, Chang MH, Moore T. Selection and maintenance of spatial information by frontal eye field neurons. J Neurosci. 2009;29:15621–15629. - PMC - PubMed
    1. Balan PF, Gottlieb J. Integration of exogenous input into a dynamic salience map revealed by perturbing attention. J Neurosci. 2006;26:9239–9249. - PMC - PubMed
    1. Balan PF, Oristaglio J, Schneider DM, Gottlieb J. Neuronal correlates of the set-size effect in monkey lateral intraparietal area. PLoS Biol. 2008;6:e158. - PMC - PubMed
    1. Barash S, Bracewell RM, Fogassi L, Gnadt JW, Andersen RA. Saccade-related activity in the lateral intraparietal area. I. Temporal properties; comparison with area 7a. J Neurophysiol. 1991;66:1095–1108. - PubMed

Publication types