

Revealing the genetic structure of a trait by sequencing a population under selection
- PMID: 21422276
- PMCID: PMC3129255
- DOI: 10.1101/gr.116731.110
Revealing the genetic structure of a trait by sequencing a population under selection
Abstract
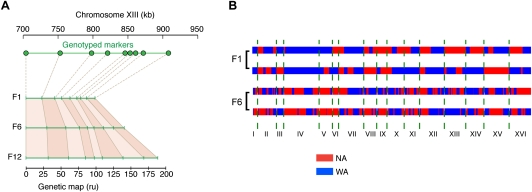
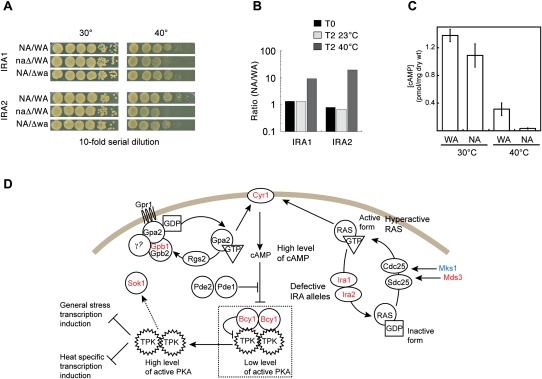
One approach to understanding the genetic basis of traits is to study their pattern of inheritance among offspring of phenotypically different parents. Previously, such analysis has been limited by low mapping resolution, high labor costs, and large sample size requirements for detecting modest effects. Here, we present a novel approach to map trait loci using artificial selection. First, we generated populations of 10-100 million haploid and diploid segregants by crossing two budding yeast strains of different heat tolerance for up to 12 generations. We then subjected these large segregant pools to heat stress for up to 12 d, enriching for beneficial alleles. Finally, we sequenced total DNA from the pools before and during selection to measure the changes in parental allele frequency. We mapped 21 intervals with significant changes in genetic background in response to selection, which is several times more than found with traditional linkage methods. Nine of these regions contained two or fewer genes, yielding much higher resolution than previous genomic linkage studies. Multiple members of the RAS/cAMP signaling pathway were implicated, along with genes previously not annotated with heat stress response function. Surprisingly, at most selected loci, allele frequencies stopped changing before the end of the selection experiment, but alleles did not become fixed. Furthermore, we were able to detect the same set of trait loci in a population of diploid individuals with similar power and resolution, and observed primarily additive effects, similar to what is seen for complex trait genetics in other diploid organisms such as humans.
Figures


Similar articles
-
High-resolution mapping of complex traits with a four-parent advanced intercross yeast population.Genetics. 2013 Nov;195(3):1141-55. doi: 10.1534/genetics.113.155515. Epub 2013 Sep 13. Genetics. 2013. PMID: 24037264 Free PMC article.
-
Identification of novel causative genes determining the complex trait of high ethanol tolerance in yeast using pooled-segregant whole-genome sequence analysis.Genome Res. 2012 May;22(5):975-84. doi: 10.1101/gr.131698.111. Epub 2012 Mar 7. Genome Res. 2012. PMID: 22399573 Free PMC article.
-
Quantifying selection acting on a complex trait using allele frequency time series data.Mol Biol Evol. 2012 Apr;29(4):1187-97. doi: 10.1093/molbev/msr289. Epub 2011 Nov 23. Mol Biol Evol. 2012. PMID: 22114362 Free PMC article.
-
Advances in quantitative trait analysis in yeast.PLoS Genet. 2012;8(8):e1002912. doi: 10.1371/journal.pgen.1002912. Epub 2012 Aug 16. PLoS Genet. 2012. PMID: 22916041 Free PMC article. Review.
-
Finding genes that underlie complex traits.Science. 2002 Dec 20;298(5602):2345-9. doi: 10.1126/science.1076641. Science. 2002. PMID: 12493905 Review.
Cited by
-
Ancient evolutionary trade-offs between yeast ploidy states.PLoS Genet. 2013 Mar;9(3):e1003388. doi: 10.1371/journal.pgen.1003388. Epub 2013 Mar 21. PLoS Genet. 2013. PMID: 23555297 Free PMC article.
-
Mapping Ethanol Tolerance in Budding Yeast Reveals High Genetic Variation in a Wild Isolate.Front Genet. 2019 Nov 20;10:998. doi: 10.3389/fgene.2019.00998. eCollection 2019. Front Genet. 2019. PMID: 31824552 Free PMC article.
-
The power to detect quantitative trait loci using resequenced, experimentally evolved populations of diploid, sexual organisms.Mol Biol Evol. 2014 Apr;31(4):1040-55. doi: 10.1093/molbev/msu048. Epub 2014 Jan 18. Mol Biol Evol. 2014. PMID: 24441104 Free PMC article.
-
Evidence for divergent evolution of growth temperature preference in sympatric Saccharomyces species.PLoS One. 2011;6(6):e20739. doi: 10.1371/journal.pone.0020739. Epub 2011 Jun 2. PLoS One. 2011. PMID: 21674061 Free PMC article.
-
Global phenotypic and genomic comparison of two Saccharomyces cerevisiae wine strains reveals a novel role of the sulfur assimilation pathway in adaptation at low temperature fermentations.BMC Genomics. 2014 Dec 3;15(1):1059. doi: 10.1186/1471-2164-15-1059. BMC Genomics. 2014. PMID: 25471357 Free PMC article.
References
-
- Brem RB, Yvert G, Clinton R, Kruglyak L 2002. Genetic dissection of transcriptional regulation in budding yeast. Science 296: 752–755 - PubMed
-
- Broman KW, Wu H, Sen S, Churchill GA 2003. R/qtl: QTL mapping in experimental crosses. Bioinformatics 19: 889–890 - PubMed
-
- Cubillos FA, Billi E, Zörgö E, Parts L, Fargier P, Omholt S, Blomberg A, Warringer J, Louis EJ, Liti G. 2011. Assessing the complex architecture of polygenic traits in diverged yeast populations. Mol Ecol 20: 1401–1413 - PubMed
Publication types
MeSH terms
Substances
Grants and funding
- 202372/CAPMC/ CIHR/Canada
- BBF0152161/BB_/Biotechnology and Biological Sciences Research Council/United Kingdom
- BB/G01616X/1/BB_/Biotechnology and Biological Sciences Research Council/United Kingdom
- BB/F015216/1/BB_/Biotechnology and Biological Sciences Research Council/United Kingdom
- WT077192/Z/05/Z/WT_/Wellcome Trust/United Kingdom
LinkOut - more resources
Full Text Sources
Other Literature Sources
Molecular Biology Databases