. 2011 Apr 26;108(17):7259-64.
doi: 10.1073/pnas.1014394108. Epub 2011 Mar 21.

Natural immune boosting in pertussis dynamics and the potential for long-term vaccine failure

Affiliations

Natural immune boosting in pertussis dynamics and the potential for long-term vaccine failure

Jennie S Lavine et al. Proc Natl Acad Sci U S A. .

Abstract

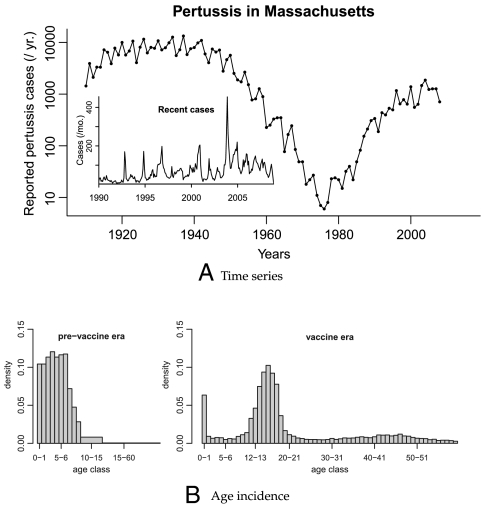
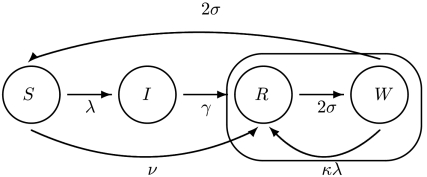
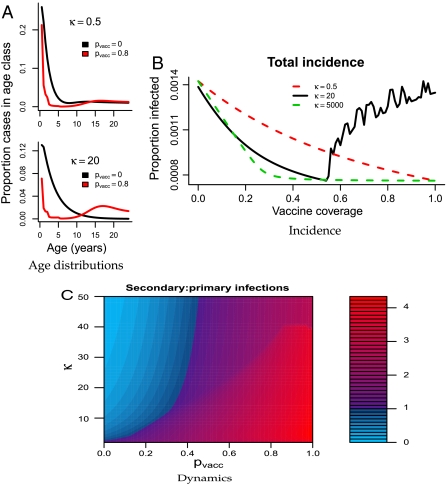
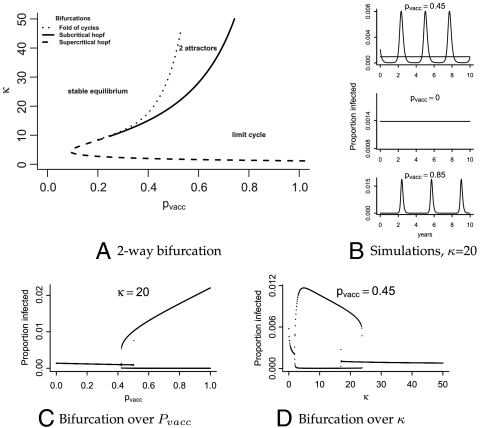
Incidence of whooping cough, unlike many other childhood diseases for which there is an efficacious vaccine, has been increasing over the past twenty years despite high levels of vaccine coverage. Its reemergence has been particularly noticeable among teenagers and adults. Many hypotheses have been put forward to explain these two patterns, but parsimonious reconciliation of clinical data on the limited duration of immunity with both pre- and postvaccine era age-specific incidence remains a challenge. We consider the immunologically relevant, yet epidemiologically largely neglected, possibility that a primed immune system can respond to a lower dose of antigen than a naive one. We hypothesize that during the prevaccine era teenagers' and adults' primed immunity was frequently boosted by reexposure, so maintaining herd immunity in the face of potentially eroding individual immunity. In contrast, low pathogen circulation in the current era, except during epidemic outbreaks, allows immunity to be lost before reexposure occurs. We develop and analyze an age-structured model that encapsulates this hypothesis. We find that immune boosting must be more easily triggered than primary infection to account for age-incidence data. We make age-specific and dynamical predictions through bifurcation analysis and simulation. The boosting model proposed here parsimoniously captures four key features of pertussis data from highly vaccinated countries: (i) the shift in age-specific incidence, (ii) reemergence with high vaccine coverage, (iii) the possibility for cyclic dynamics in the pre- and postvaccine eras, and (iv) the apparent shift from susceptible-infectious-recovered (SIR)-like to susceptible-infectious-recovered-susceptible (SIRS)-like phenomenology of infection and immunity to Bordetella pertussis.


Conflict of interest statement

The authors declare no conflict of interest.

Figures

Fig. 1.
Fig. 1.
(A) The number of reported pertussis cases in Massachusetts. The main plot shows cases aggregated yearly from 1910 to 2008. (Inset) Cases aggregated monthly from 1990 to 2008. (B) The distribution of ages of reported infections in Massachusetts. (Left Cases identified between 1918 and 1921, with cases aggregated into twelve age groups (year long from 0 to 10 years of age, then 10–15, and > 15). (Right) Cases identified between January 1988 and December 2008, with all cases aggregated into year-long age intervals.
Fig. 2.
Fig. 2.
A flow-diagram of the basic model. Individuals in class R (recovered) are resistant to infection and immune boosting. Those in W (waning) are resistant to infection but their immunity can be boosted at a rate determined by the force of infection, λ, and the value of the boosting coefficient, κ. The duration of immunity to infection is determined by the length of time spent in the circled loop, which depends on the relative magnitude of the competing rates κλ and σ.
Fig. 3.
Fig. 3.
(A) The model-predicted age distribution at different levels of vaccine coverage for κ = 0.5 and κ = 20 and n = 10. The y-axes indicate the proportion of the total population infected at age a, averaged over time. (Top) Predicted age distributions for κ = 0.5, with pvacc = 0 (black) or pvacc = 0.8 (red). The only age group whose incidence significantly changes from the pre- to postvaccine era is young children who are directly protected by the vaccine. (Bottom) The same results, but for κ = 20. Vaccination results in a decrease in infant cases and an increase in teenage and adult cases, consistent with the data. (B) Mean asymptotic incidence as vaccine coverage increases for κ = 0.5 (red), κ = 20 (black), and κ = 5,000 (green). For low κ disease incidence monotonically decreases as vaccine coverage increases. For the moderate value of κ incidence decreases until a critical vaccine coverage threshold (pvacc ≈ 0.55 with these parameters), at which point it begins increasing again, thereby predicting failure to control disease in the presence of high vaccine coverage. For extremely high κ, herd immunity is restored and incidence decreases monotonically again. (C) Contour plot of the ratio of secondary to primary cases across vaccine coverage (pvacc) and varying values of the boosting coefficient (κ). The area of parameter space in which there are more primary than secondary cases is in shades of blue. Areas in which more secondary cases are expected are in shades of purple to red. For low values of κ, the model predicts more secondary than primary cases even in the absence of vaccine coverage (purple in the bottom left corner). For values of κ > 1 the model allows for predominantly primary cases in the prevaccine era (blue on the left), shifting to predominantly secondary cases with higher vaccine coverage (purples and reds on the right). For areas of parameter space in which there are coexisting cyclic and equilibrial attractors, the results from the fluctuating regimes are shown.
Fig. 4.
Fig. 4.
(A) Curves indicating the location of bifurcation: supercritical Hopf (dashed line), subcritical Hopf (solid line), and fold of limit cycles (dotted line). (B) Simulated trajectories in each dynamical regime with κ set to 20, and three vaccine coverages. (Top) Coexisting cycle and equilibrium. A sample trajectory from the region with only a stable equilibrium is shown in the middle, and only a limit cycle on the bottom. (C) One-dimensional bifurcation diagram over pvacc. The maximum and minimum infected proportions of the population are shown from simulations over increasing and decreasing vaccine coverage, thereby capturing both attractors in the area in which they coexist (0.4 ≲ pvacc ≲ 0.5). (D) Same as (C) but varying κ instead of pvacc.
Fig. 5.
Fig. 5.
Effect of 80% coverage with a teenage booster vaccine given at age 15. The arrows indicate ages at which vaccination can occur (0.5, 2, 5, and 15 years). The white bars show the age distribution without the booster dose at 15 years; the black bars show the distribution with the booster. The y-axis is normalized by the total number of cases in the no-booster regime. Simulations carried out with n = 10.

Comment in

  • Boosting understanding of pertussis outbreaks.
    Grenfell B. Grenfell B. Proc Natl Acad Sci U S A. 2011 May 3;108(18):7279-80. doi: 10.1073/pnas.1103408108. Epub 2011 Apr 20. Proc Natl Acad Sci U S A. 2011. PMID: 21508325 Free PMC article. No abstract available.

References

    1. Gordon JE, Hood RI. Whooping cough and its epidemiological anomalies. Am J Med Sci. 1951;222:333–361. - PubMed
    1. Geier D, Geier M. The true story of pertussis vaccination: A sordid legacy? J Hist Med All Sci. 2002;57:249–284. - PubMed
    1. Madsen T. Vaccination against whooping cough. J Am Med Assoc. 1933;101:187–188.
    1. Bass JW, Wittler RR. Return of epidemic pertussis in the United States. Pediatr Infect Dis J. 1994;13:343–345. - PubMed
    1. Yih WK, et al. The increasing incidence of pertussis in Massachusetts adolescents and adults, 1989-1998. J Infect Dis. 2000;182:1409–1416. - PubMed

Publication types

Substances