. 2011 Apr 12;108(15):5946-53.
doi: 10.1073/pnas.1103090108. Epub 2011 Mar 21.

Electrostatic influences of charged inner pore residues on the conductance and gating of small conductance Ca2+ activated K+ channels

Affiliations

Electrostatic influences of charged inner pore residues on the conductance and gating of small conductance Ca2+ activated K+ channels

Weiyan Li et al. Proc Natl Acad Sci U S A. .

Abstract

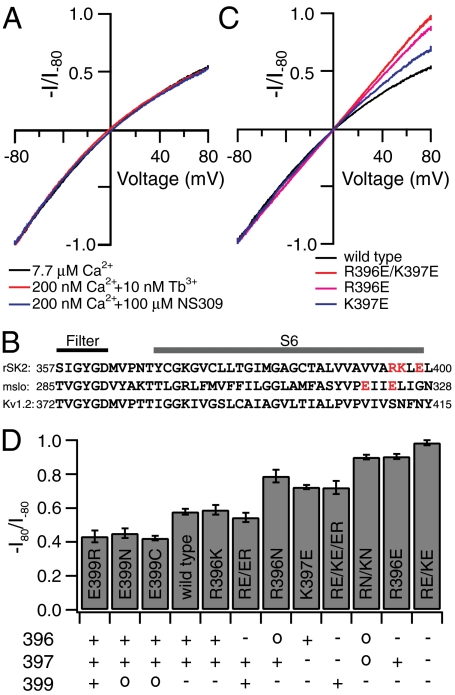
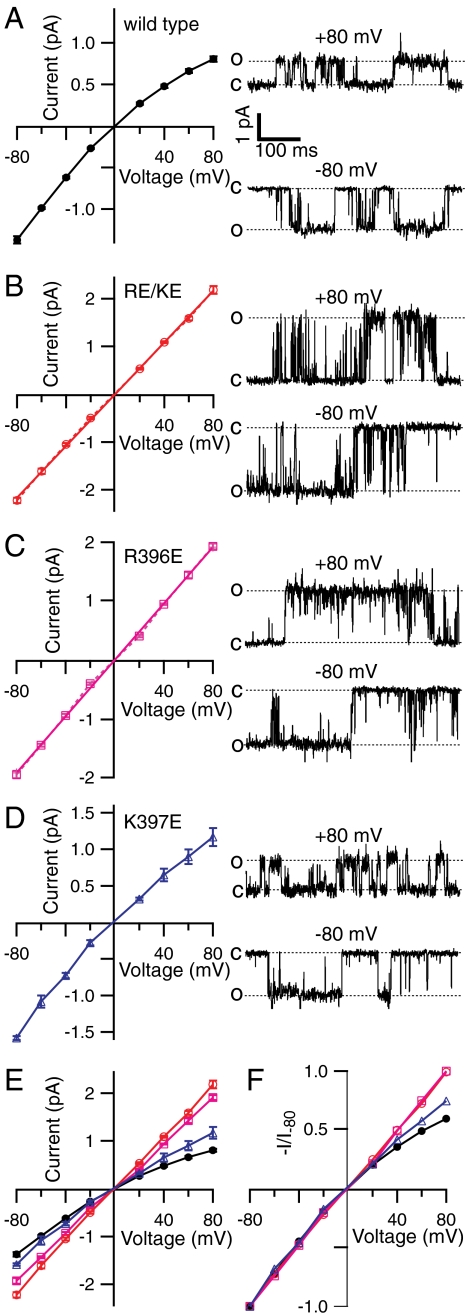
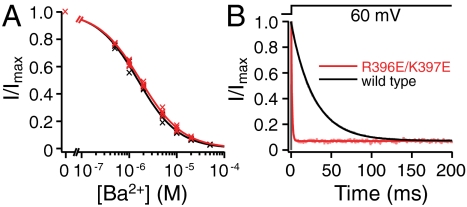
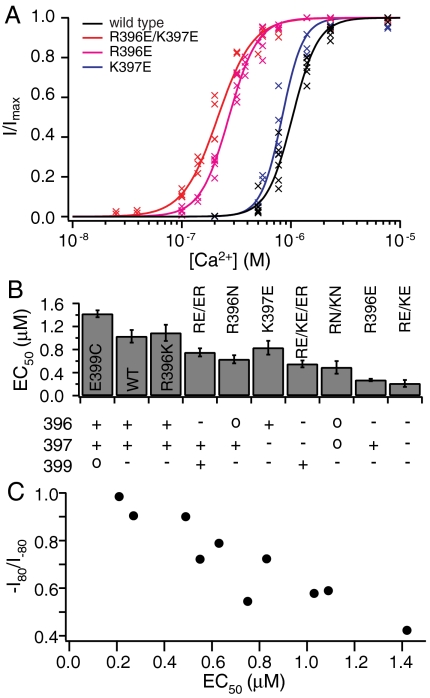
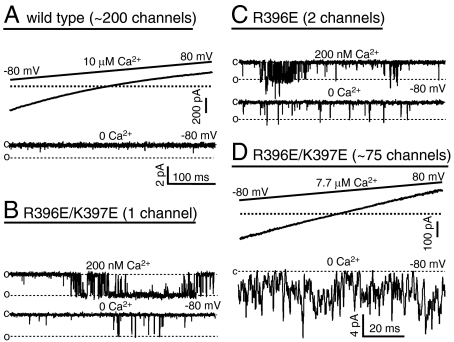
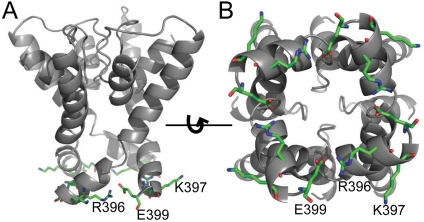
SK channels underlie important physiological functions by linking calcium signaling with neuronal excitability. Potassium currents through SK channels demonstrate inward rectification, which further reduces their small outward conductance. Although it has been generally attributed to block of outward current by intracellular divalent ions, we find that inward rectification is in fact an intrinsic property of SK channels independent of intracellular blockers. We identified three charged residues in the S6 transmembrane domain of SK channels near the inner mouth of the pore that collectively control the conductance and rectification through an electrostatic mechanism. Additionally, electrostatic contributions from these residues also play an important role in determining the intrinsic open probability of SK channels in the absence of Ca(2+), affecting the apparent Ca(2+) affinity for activation.


Conflict of interest statement

The authors declare no conflict of interest.

Figures

Fig. 1.
Fig. 1.
Charged residues near the inner mouth influence the intrinsic rectification of SK channels. (A). Representative SK currents in response to a voltage ramp from -80 mV to 80 mV, recorded under inside-out patch clamp configuration, are normalized to the current level at -80 mV to compare inward rectification. SK currents are activated by 7.7 μM Ca2+ (chelated with 5 mM HEDTA) (black), by 10 nM Tb3+ added to the Chelex-100 column-treated chelator-free internal solution (contaminating Ca2+ approximately 200 nM) (red), or by 200 nM Ca2+ (chelated with 5 mM EGTA) in the presence of 100 μM NS309 (blue). (B). Alignment of the sequence in the S6 domain between SK (rSK2), BK (mslo), and Kv1.2 K+ channels. Charged residues of interest in SK and BK channels are highlighted in red. (C). Representative SK currents activated by 7.7 μM Ca2+ for R396E/K397E (red), R396E (purple), and K397E channels (blue) are normalized and plotted together to compare inward rectification with wild type (black). (D). The average levels of inward rectification, characterized by the ratio between current amplitude at 80 mV and that at -80 mV (-I80/I-80), were determined from three to six patches for each type of mutant or wild-type channel. Mean value ± SD is plotted for each construct. Expected charges at positions 396, 397, and 399 for wild-type and mutant channels are shown for each construct below the bar graph.
Fig. 2.
Fig. 2.
Inward rectification of SK channels is determined by single-channel conductance. Single-channel current amplitude at different voltages was measured from patches containing one to three channels with multiple-Gaussian fitting of the all-point amplitude histograms. Average amplitudes are plotted as a function of voltage with error bars representing SEM for wild-type (A, n = 5), R396E/K397E (B, n = 4), R396E (C, n = 4), and K397E channels (D, n = 3) next to representative single-channel traces at -80 and 80 mV (Right). In B and C the dashed lines in the plot simply connect the data points, whereas the solid lines are linear fits of the data, indicating the lack of inward rectification for R396E/K397E and R396E channels. Results from A to D are plotted together in E to compare single-channel current amplitudes. In F IV relationships are normalized to the average current amplitude at -80 mV to compare the level of inward rectification.
Fig. 3.
Fig. 3.
Comparison of block by Ba2+ between wild-type and R396E/K397E channels. (A). SK currents were recorded with a 400-ms voltage step to 60 mV from a holding potential of -80 mV. The steady-state current levels with different concentrations of Ba2+ were measured at the end of step or determined using single exponential fits of the current traces, then normalized to the control level in the absence of Ba2+ and plotted as a function of Ba2+ concentration. Data from four patches for wild-type (black crosses) and four patches for R396E/K397E channels (red crosses) were individually fitted with the Hill equation (individual fits not depicted): I/Imax = 1/[1 + ([Ba2+]/IC50)h], where IC50 is the half-block Ba2+ concentration, and h is the Hill coefficient. Average IC50 and h values are reflected by the solid lines for wild-type (black) and R396E/K397E channels (red). (B) SK currents were recorded in the presence of 20 μM Ba2+ with a voltage step to 60 mV from a holding potential of -80 mV. Currents are normalized to the peak values at the beginning of the voltage step. Current traces are fitted with single exponential time courses (solid lines). Rates of relaxation from the fits in this figure are 1/τ = 35.2 s-1 (wild type, black line), and 1/τ = 1,029.1 s-1 (R396E/K397E, red line). Average results from similar experiments are 1/τ = 35.3 ± 3.6 s-1 (wild type, n = 4), and 1/τ = 1,064.8 ± 69.4 s-1 (R396E/K397E, n = 4).
Fig. 4.
Fig. 4.
Charged residues near the inner mouth influence the apparent Ca2+ affinity for SK channel activation. (A). Mean current levels at -80 mV in the presence of different Ca2+ concentrations were measured and normalized to the maximal current level in saturating Ca2+ and plotted as a function of Ca2+ concentration. Data points from three to six patches for each channel type are plotted together (crosses). Data from each individual patch were fitted with a Hill equation I/Imax = 1/[1 + (EC50/[Ca2+])h], where EC50 is the Ca2+ concentration at which channels open at the half-maximal level, and h is the Hill coefficient. Average results from individual fits are represented as the solid lines for wild-type (black), R396E/K397E (red), R396E (pink), and K397E channels (blue). (B). Average EC50 values from the Hill fits are plotted with SD for wild-type and all mutant channels, whereas the charges at positions 396, 397, and 399 for each channel type are shown below the bar graph. C). Correlation between the level of inward rectification and EC50 for wild type and all mutant channels.
Fig. 5.
Fig. 5.
Charge reversal at R396 and K397 increases the Po of SK channels in the absence of Ca2+. (A). Wild-type SK currents activated with a saturating 10 μM Ca2+ in response to a voltage ramp from -80 to 80 mV (Top). Based on the amount of total current at -80 mV and the average single-channel current amplitude at -80 mV (Fig. 2A), this patch has approximately 200 SK channels. The patch was then treated with nominally Ca2+-free solution (0 Ca2+) and current was recorded at a holding potential of -80 mV (Bottom). The dashed line indicates the expected single-channel current level. The scale bar is the same for single-channel records in AC. (B). Single-channel recording at -80 mV from a membrane patch containing R396E/K397E channels. In the presence of 200 nM Ca2+, the channel opens frequently with no double opening, suggesting a single channel in the patch (Top). This channel occasionally opens in 0 Ca2+ (Bottom). (C). Single-channel recording from a patch containing R396E channels at -80 mV in the presence of 200 nM Ca2+ (Top). Based on the overall Po and the presence of double opening, two channels are likely to be present in this patch. R396E channels occasionally open in 0 Ca2+ (Bottom). (D). Po of unliganded R396E/K397E channels was estimated by the ratio between the average current level in 0 Ca2+ (Bottom) and the average current in 7.7 μM Ca2+ at -80 mV (Top).
Fig. 6.
Fig. 6.
Structural model of the SK channel pore based on the Kv1.2 structure. Sequence of rSK2 was threaded into the structure of Kv1.2 using the “SwissModel” function in Swiss-PdbViewer software. (A). A view of the model from the side of the channel pore. R396, K397, and E399 are shown as sticks. Nitrogen atoms are shown in blue and oxygen atoms in red. (B). A view of the model from the intracellular side of the channel pore.

References

    1. Pedarzani P, Stocker M. Molecular and cellular basis of small- and intermediate-conductance, calcium-activated potassium channel function in the brain. Cell Mol Life Sci. 2008;65:3196–3217. - PMC - PubMed
    1. Faber ES. Functions and modulation of neuronal SK channels. Cell Biochem Biophys. 2009;55:127–139. - PubMed
    1. Xia XM, et al. Mechanism of calcium gating in small-conductance calcium-activated potassium channels. Nature. 1998;395:503–507. - PubMed
    1. Maylie J, Bond CT, Herson PS, Lee WS, Adelman JP. Small conductance Ca2+-activated K+ channels and calmodulin. J Physiol. 2004;554:255–261. - PMC - PubMed
    1. Soh H, Park CS. Inwardly rectifying current-voltage relationship of small-conductance Ca2+-activated K+ channels rendered by intracellular divalent cation blockade. Biophys J. 2001;80:2207–2215. - PMC - PubMed

MeSH terms

Substances

LinkOut - more resources