Comparative Study
. 2011 Apr 5;108(14):5724-9.
doi: 10.1073/pnas.1013084108. Epub 2011 Mar 21.

Single-cell gene-expression profiling reveals qualitatively distinct CD8 T cells elicited by different gene-based vaccines

Affiliations
Comparative Study

Single-cell gene-expression profiling reveals qualitatively distinct CD8 T cells elicited by different gene-based vaccines

Lukas Flatz et al. Proc Natl Acad Sci U S A. .

Abstract

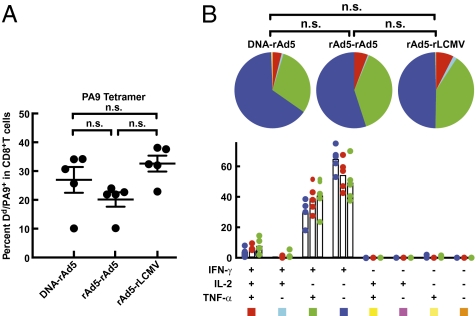
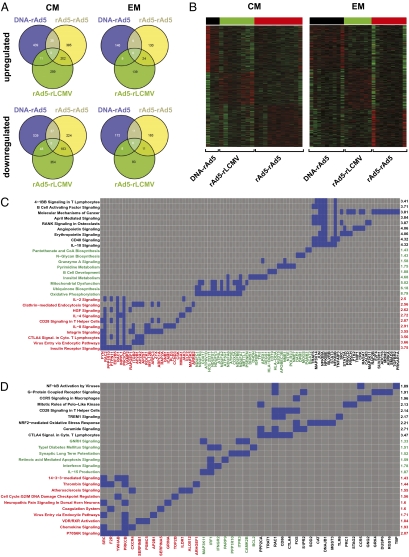
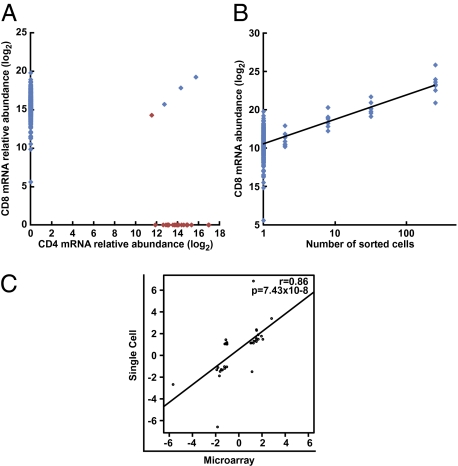
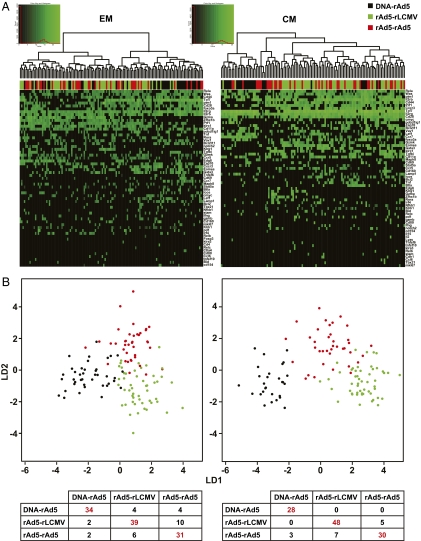
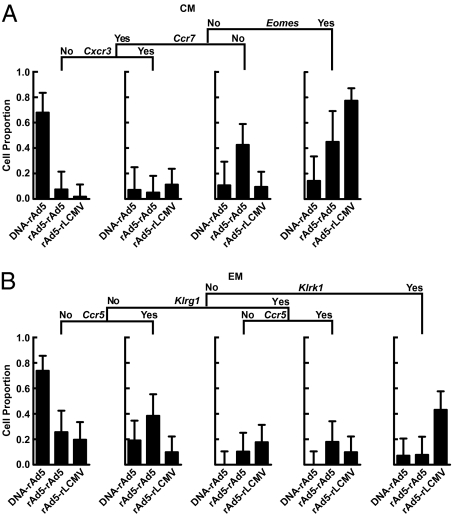
CD8 T cells play a key role in mediating protective immunity against selected pathogens after vaccination. Understanding the mechanism of this protection is dependent upon definition of the heterogeneity and complexity of cellular immune responses generated by different vaccines. Here, we identify previously unrecognized subsets of CD8 T cells based upon analysis of gene-expression patterns within single cells and show that they are differentially induced by different vaccines. Three prime-boost vector combinations encoding HIV Env stimulated antigen-specific CD8 T-cell populations of similar magnitude, phenotype, and functionality. Remarkably, however, analysis of single-cell gene-expression profiles enabled discrimination of a majority of central memory (CM) and effector memory (EM) CD8 T cells elicited by the three vaccines. Subsets of T cells could be defined based on their expression of Eomes, Cxcr3, and Ccr7, or Klrk1, Klrg1, and Ccr5 in CM and EM cells, respectively. Of CM cells elicited by DNA prime-recombinant adenoviral (rAd) boost vectors, 67% were Eomes(-) Ccr7(+) Cxcr3(-), in contrast to only 7% and 2% stimulated by rAd5-rAd5 or rAd-LCMV, respectively. Of EM cells elicited by DNA-rAd, 74% were Klrk1(-) Klrg1(-)Ccr5(-) compared with only 26% and 20% for rAd5-rAd5 or rAd5-LCMV. Definition by single-cell gene profiling of specific CM and EM CD8 T-cell subsets that are differentially induced by different gene-based vaccines will facilitate the design and evaluation of vaccines, as well as enable our understanding of mechanisms of protective immunity.


Conflict of interest statement

Conflict of interest statement: M.L. is a research technician for Fluidigm Corporation.

Figures

Fig. 1.
Fig. 1.
Gene-based vaccine regimens and assessment of resultant CD8+ T-cell responses. Animals were immunized intramuscularly with DNA-rAd, rAd-rAd, or rAd-LCMV encoding HIV-1 Env, titrated to elicit similar frequencies of CD8+ T cells specific for the PA9 epitope in HIV-1 Env 3 wk following boost immunization. (A) pMHC tetramer staining. H2-Dd/PA9 tetramer staining of splenocytes isolated at 3 wk postimmunization. (B) Intracellular cytokine analysis following PA9 peptide stimulation. Splenocytes were pulsed with PA9 peptide and stained intracellularly for IFN-γ, TNF-α, and IL2 after 5 h. Similar results were obtained in three independent experiments. Data show the mean of five mice per group of one representative experiment.
Fig. 2.
Fig. 2.
Microarray analysis of global gene expression in vaccine-elicited CD8+ T cells. (A) The three vaccine regimens uniquely induce distinct sets of genes. H2-Dd/PA9-binding CD8+ T cells from the spleens of immunized mice were isolated and gene transcription was analyzed by cDNA microarray hybridization. Venn diagrams indicate the number of uniquely up- or down-regulated genes induced by the three immunization regimens (P < 0.05) (see Table S1 for the complete list). (B) Gene expression heatmaps of the uniquely up-regulated genes in each immunization group (red indicates high and green indicates low relative expression). (C and D) Enrichment analysis of the uniquely up-regulated genes within EM and CM compartments for each immunization (black: DNA-rAd5; green: rAd5-rLCMV; red: rAd5-rAd5) using the canonical pathway gene sets from Ingenuity Pathway Analysis Software. The gray and blue colors of the figures show the representative pathway membership for each gene (blue: present in the pathway; gray: absent). The identifiers of the most significant (P < 0.05) pathways are displayed on the left side and -Log10(p) on the right side of each figure. The overrepresentation test was performed using Fisher's exact test. Microarray comparisons are based on data obtained in two independent experiments.
Fig. 3.
Fig. 3.
Validation of single-cell gene-expression analysis. (A) Evaluation of false-positive signals. Individual CD4 or CD8 single-positive lymphocytes were sorted by FACS and analyzed for the expression of CD4 and CD8a mRNA in addition to all other transcripts evaluated. Red dots show CD4 single-positive cells and blue dots show CD8 single-positive cells. (B) Evaluation of signal linearity. A titration of CD8+ cells through a range of cell counts from 128 cells down to single cells was sorted by FACS and analyzed for the cd8a mRNA abundance in addition to all other transcripts evaluated. (C) Validation of single-cell gene expression measurements. Single-cell gene-expression data were validated by comparison with microarray analysis of pooled populations of cells. Single H2-Dd/PA9 binding CM and EM cells were either individually sorted and the proportion of positive cells for each transcript evaluated, or cells were pooled and analyzed by conventional cDNA hybridization microarrays. The proportion of positive cells for each transcript was then compared, where possible, with microarray fold-change values. Each point reflects one gene transcript evaluated. Data analysis of single-sorted T cells is based on two independent experiments.
Fig. 4.
Fig. 4.
Analysis of single-cell gene expression in vaccine-elicited CD8+ T cells. Resting H2-Dd/PA9 tetramer binding cells were isolated from the spleens of immunized mice. Expression of the indicated mRNA transcripts was assessed by single cell quantitative RT-PCR. and individually sorted into 96-well plates. Following reverse transcription of cellular mRNA using specific primers, each single-cell cDNA mixture was subjected to 18 cycles of PCR preamplification before microfluidic separation into a further 96 separate reactions for the specific quantification of single-gene transcripts by quantitative RT-PCR. (A) Gene-expression heatmaps of single-cell gene-expression profiles obtained after two-way hierarchical clustering using Euclidean distance and Ward agglomeration methods. The coexpression of gene transcripts within single CD8+ T cells elicited by the three immunizations was analyzed. (B) Linear discriminant analysis. To assess whether single-cell gene-expression profiles could be used to discriminate individual EM (Left) or CM (Right) CD8+ T cells elicited by the three different immunization regimens, we performed a Fisher Linear Discriminant Analysis on the dataset. Each dot represents a single cell (black: DNA-rAd, green: rAd-rLCMV, red: rAd-rAd). The truth tables below each heatmap represent a crossvalidation of the linear discriminant analysis and compare predicted classifications (columns) with the actual immunization regimen used (rows). Both EM and CM cells elicited by the three immunizations could be readily discriminated, as indicated by a low rate of misclassification (12.4% for CM T cells and 21.2% for EM T cells). Data analysis of single cell sorted T cells is based on two independent experiments.
Fig. 5.
Fig. 5.
Decision-tree analysis of single-cell gene expression profiles. Gene-expression data were analyzed to determine whether assessment of single-cell coexpression in a smaller subset of genes could allow the classification of cells elicited by the three immunization groups. Bar graphs showing leaf statistics represent the proportion of cells elicited by each immunization group which satisfy the given transcriptional pattern as indicated in the regression tree. (A) CM, (B) EM CD8 T cells. The genes used for decision tree analysis were selected following Fisher's exact test to identify the top seven and top four most significantly discriminating genes for CM (Table S3) and EM (Table S4) respectively (Bonferroni threshold 0.0008).

References

    1. Seder RA, Darrah PA, Roederer M. T-cell quality in memory and protection: Implications for vaccine design. Nat Rev Immunol. 2008;8:247–258. - PubMed
    1. Sekaly RP. The failed HIV Merck vaccine study: A step back or a launching point for future vaccine development? J Exp Med. 2008;205(1):7–12. - PMC - PubMed
    1. Wilson NA, et al. Vaccine-induced cellular responses control simian immunodeficiency virus replication after heterologous challenge. J Virol. 2009;83:6508–6521. - PMC - PubMed
    1. Liu J, et al. Immune control of an SIV challenge by a T-cell-based vaccine in rhesus monkeys. Nature. 2009;457(7225):87–91. - PMC - PubMed
    1. Reynolds MR, et al. Macaques vaccinated with live-attenuated SIV control replication of heterologous virus. J Exp Med. 2008;205:2537–2550. - PMC - PubMed

Publication types

MeSH terms