. 2011 Apr 5;108(14):5702-7.
doi: 10.1073/pnas.1013850108. Epub 2011 Mar 21.

Genetic basis of eye and pigment loss in the cave crustacean, Asellus aquaticus

Affiliations

Genetic basis of eye and pigment loss in the cave crustacean, Asellus aquaticus

Meredith E Protas et al. Proc Natl Acad Sci U S A. .

Abstract

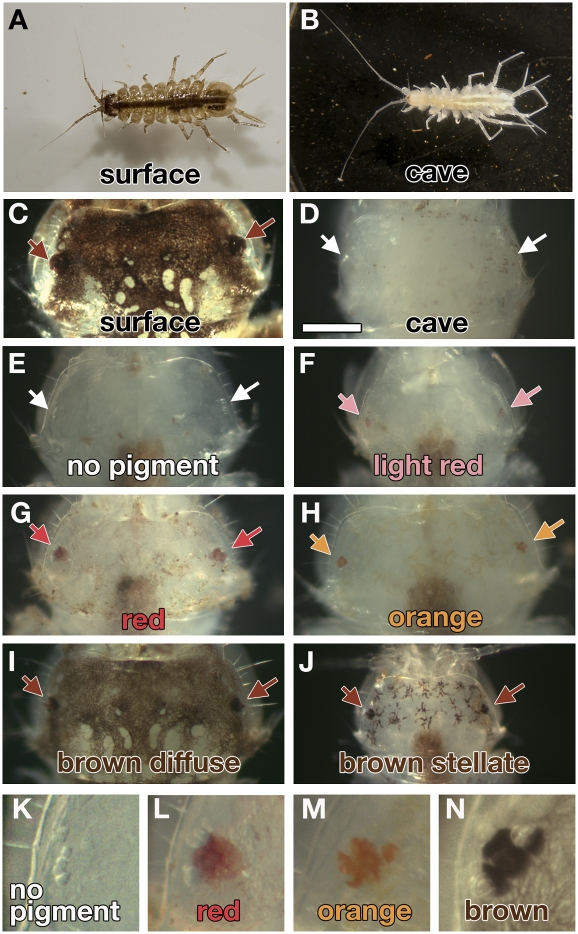
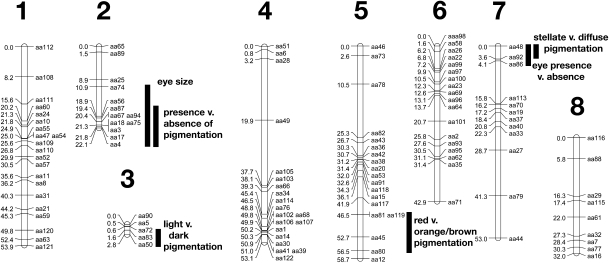
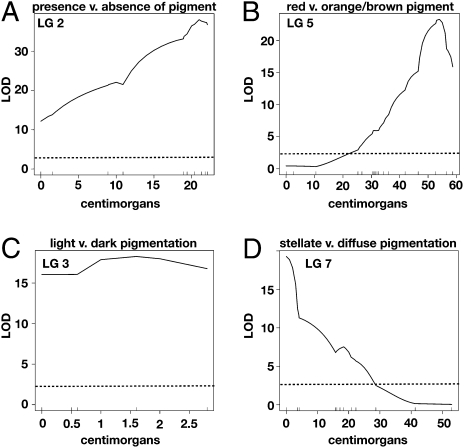
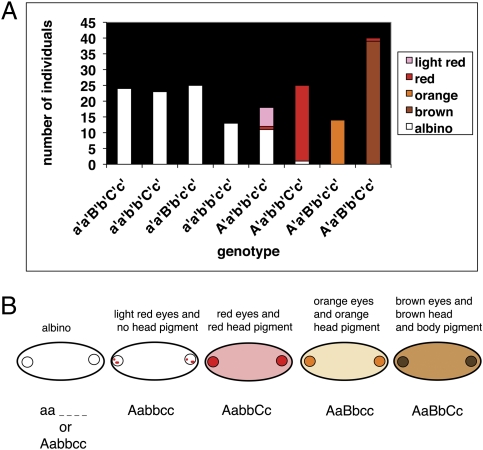
Understanding the process of evolution is one of the great challenges in biology. Cave animals are one group with immense potential to address the mechanisms of evolutionary change. Amazingly, similar morphological alterations, such as enhancement of sensory systems and the loss of eyes and pigmentation, have evolved multiple times in a diverse assemblage of cave animals. Our goal is to develop an invertebrate model to study cave evolution so that, in combination with a previously established vertebrate cave system, we can address genetic questions concerning evolutionary parallelism and convergence. We chose the isopod crustacean, Asellus aquaticus, and generated a genome-wide linkage map for this species. Our map, composed of 117 markers, of which the majority are associated with genes known to be involved in pigmentation, eye, and appendage development, was used to identify loci of large effect responsible for several pigmentation traits and eye loss. Our study provides support for the prediction that significant morphological change can be mediated through one or a few genes. Surprisingly, we found that within population variability in eye size occurs through multiple mechanisms; eye loss has a different genetic basis than reduced eye size. Similarly, again within a population, the phenotype of albinism can be achieved by two different genetic pathways--either by a recessive genotype at one locus or doubly recessive genotypes at two other loci. Our work shows the potential of Asellus for studying the extremes of parallel and convergent evolution-spanning comparisons within populations to comparisons between vertebrate and arthropod systems.


Conflict of interest statement

The authors declare no conflict of interest.

Figures

Fig. 1.
Fig. 1.
Pigmentation differences in cave, surface, and backcross individuals of A. aquaticus. (A) Surface male from Planina Polje surface waters. (B) Cave male from Planina cave (Pivka channel). Heads of surface (C), cave (D), and backcross (EJ) animals. Arrows show the eye spots. (E and K) No eye or head pigmentation. Brown dots are debris on the exterior of the animal. (F) Faint red eye and no head pigmentation. (G and L) Red eye and head pigmentation. (H and M) Orange eye and head pigmentation. (I and N) Brown eye pigment and diffuse brown pigmentation. (J) Brown eye pigment and stellate brown pigmentation. (Scale bar: 0.25 mm; applies to CJ). The gut in individuals (EH and J) is brown from eating decaying leaves.
Fig. 2.
Fig. 2.
Linkage map of A. aquaticus. Linkage group (LG) number is listed above each linkage group diagram. Placement in centimorgans is to the left and marker name to the right. The 1.5 LOD support intervals for each trait are shown with black vertical bars.
Fig. 3.
Fig. 3.
Loci responsible for pigmentation traits. LG is listed at the top of all graphs. (A) LOD score or measure of significance for the trait of presence vs. absence of pigmentation. (B) LOD plot for the trait of red vs. orange/brown pigment. (C) LOD plot for the trait of light vs. dark. Note that the LOD score is high across the entire linkage group because of the small size (2.5 cM) of the linkage group. (D) LOD plot for the trait of stellate vs. diffuse pigment pattern. The graphs were generated by using the binary method in R/qtl. The dotted lines in all graphs are the genome-wide significance levels (α < 0.05) by permutation test, LOD = 2.41. The vertical lines above the x axis are the placement of all markers across the linkage group.
Fig. 4.
Fig. 4.
Pigmentation genotypes and three gene model of color. (A) Genotypes at three different markers—aa75, aa45, and aa83—and corresponding phenotypes of backcross individuals. A′ a′ are alleles for marker aa75, B′ b′ for marker aa45, and C′ c′ for marker aa83. Most genotypic classes have one predominant phenotype. (B) Model to explain the genotypic basis of the different pigmentation phenotypes. Circles represent eye spots. Five phenotypic classes are observed: albino, faint red eyes and no head pigment, red eyes and red head pigmentation, orange eyes and orange head pigmentation, and brown eyes and brown head and body pigmentation. The predicted genotype of each phenotypic class is shown at the bottom of the schematics. A and a are the surface and cave alleles, respectively, of the unknown gene responsible for presence vs. absence of pigmentation. B and b are the alleles of the unknown gene responsible for red vs. orange/brown pigmentation. C and c are the alleles of the unknown gene responsible for light vs. dark pigmentation.
Fig. 5.
Fig. 5.
Eye size phenotypes and distribution in the backcross families. (A) A pigmented surface individual with four ommatidia. (B) A backcross individual with no external ommatidia. (C) A backcross individual with eight ommatidial fragments. (D) A backcross individual with four ommatidia. (E) Distribution of eye size for backcross families that have the eyeless phenotype. (F) Distribution of eye size for backcross families that do not have the eyeless phenotype. (G) Locus responsible for the qualitative phenotype of eye loss versus any sized eye using the binary method in R/qtl. Dotted line shows the genome-wide significance levels (α < 0.05) by permutation test, LOD = 2.41. (H) QTL for eye size in the families that have complete eye loss using Haley–Knott regression in R/qtl. Dotted line shows the genome-wide significance levels (α < 0.05) by permutation test, LOD = 2.42. Linkage group is listed at the top of the graph (G and H). (Scale bar: 0.125 mm; applies to AD).

References

    1. Culver DC. Cave Life. Cambridge, MA: Harvard Univ Press; 1982.
    1. Manceau M, Domingues VS, Linnen CR, Rosenblum EB, Hoekstra HE. Convergence in pigmentation at multiple levels: Mutations, genes and function. Philos Trans R Soc Lond B Biol Sci. 2010;365:2439–2450. - PMC - PubMed
    1. Jeffery WR. Chapter 8. Evolution and development in the cavefish Astyanax. Curr Top Dev Biol. 2009;86:191–221. - PMC - PubMed
    1. Wilkens H. Evolution and genetics of epigean and cave Astyanax (Characidae, Pisces) Evol Biol. 1988;23:271–367.
    1. Borowsky R, Wilkens H. Mapping a cave fish genome: polygenic systems and regressive evolution. J Hered. 2002;93:19–21. - PubMed

Publication types

MeSH terms

LinkOut - more resources