

Molecular imaging of influenza and other emerging respiratory viral infections
- PMID: 21422476
- PMCID: PMC3080905
- DOI: 10.1093/infdis/jir038
Molecular imaging of influenza and other emerging respiratory viral infections
Abstract
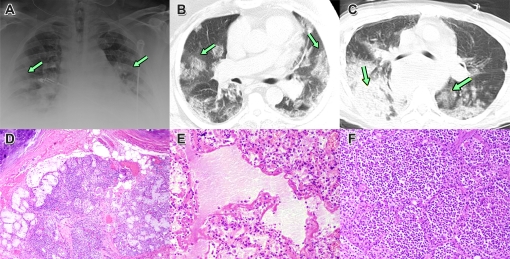
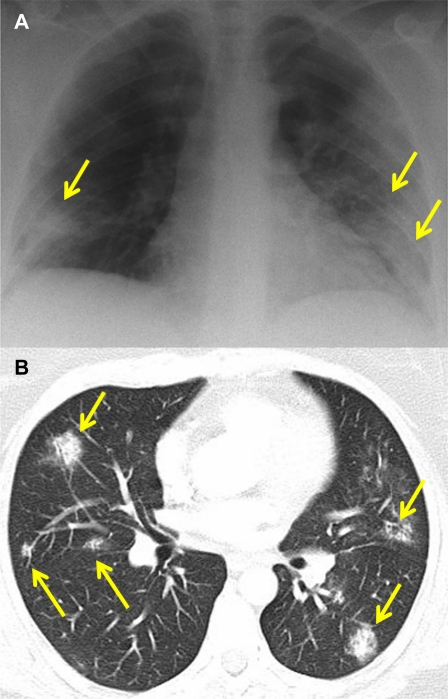
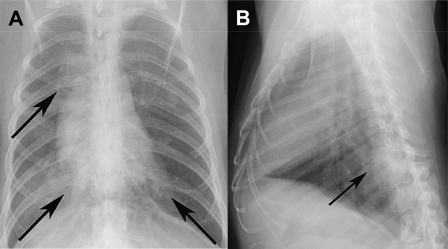
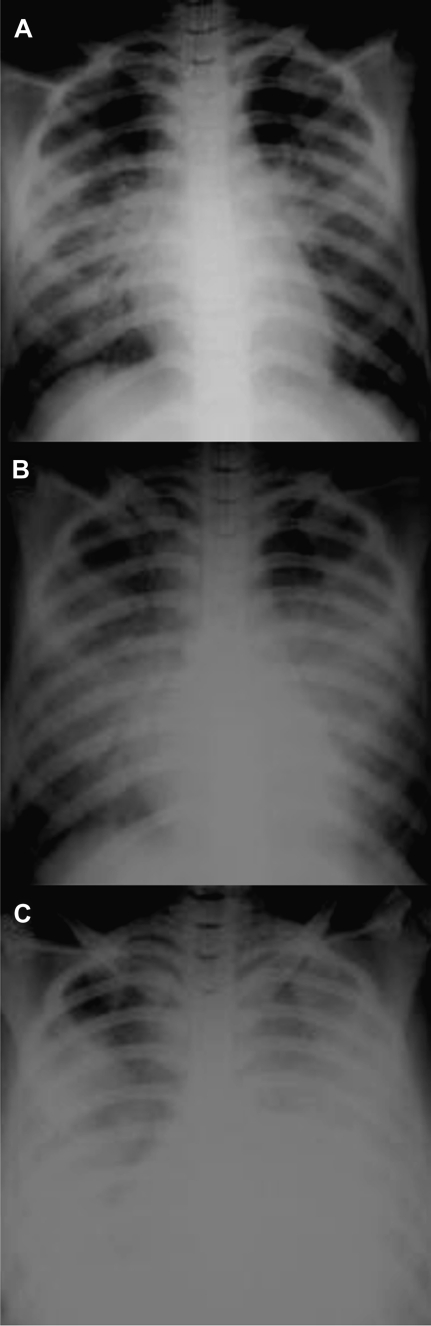
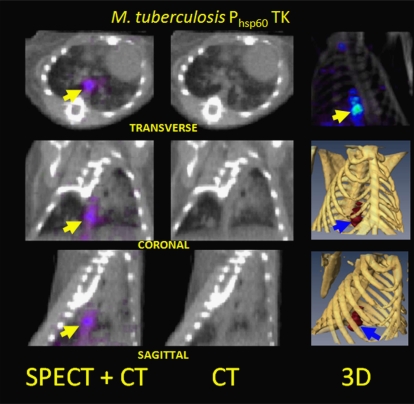
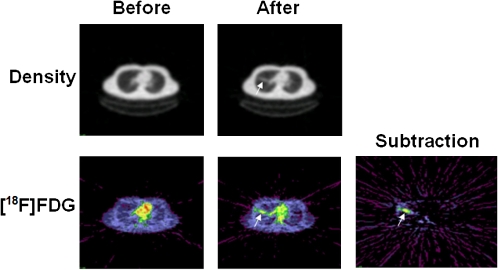
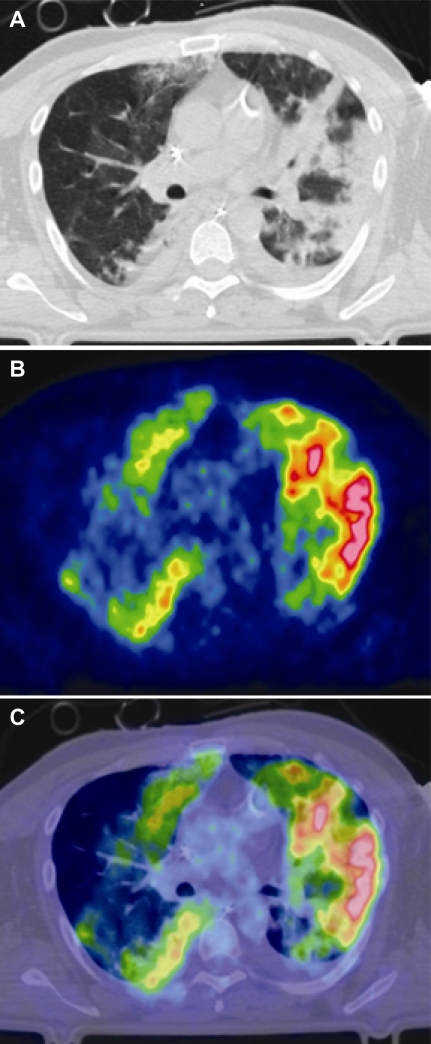
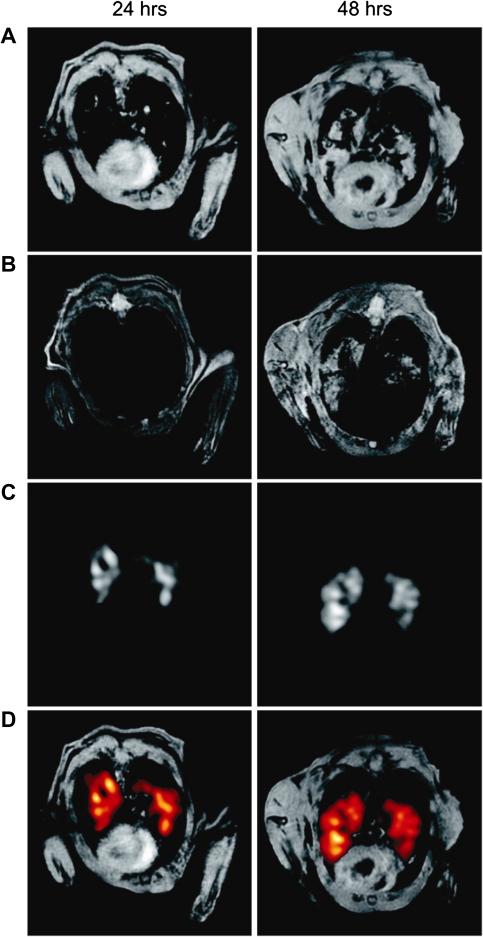
Research on the pathogenesis and therapy of influenza and other emerging respiratory viral infections would be aided by methods that directly visualize pathophysiologic processes in patients and laboratory animals. At present, imaging of diseases, such as swine-origin H1N1 influenza, is largely restricted to chest radiograph and computed tomography (CT), which can detect pulmonary structural changes in severely ill patients but are more limited in characterizing the early stages of illness, differentiating inflammation from infection or tracking immune responses. In contrast, imaging modalities, such as positron emission tomography, single photon emission CT, magnetic resonance imaging, and bioluminescence imaging, which have become useful tools for investigating the pathogenesis of a range of disease processes, could be used to advance in vivo studies of respiratory viral infections in patients and animals. Molecular techniques might also be used to identify novel biomarkers of disease progression and to evaluate new therapies.
Figures
Similar articles
-
Emerging H7N9 influenza A (novel reassortant avian-origin) pneumonia: radiologic findings.Radiology. 2013 Sep;268(3):882-9. doi: 10.1148/radiol.13130988. Epub 2013 Jul 2. Radiology. 2013. PMID: 23821754
-
Novel influenza A (H1N1) virus infection in children: chest radiographic and CT evaluation.Korean J Radiol. 2010 Nov-Dec;11(6):656-64. doi: 10.3348/kjr.2010.11.6.656. Epub 2010 Oct 29. Korean J Radiol. 2010. PMID: 21076592 Free PMC article.
-
[The relationship between chest CT findings and viral load in patients with novel influenza A (H1N1)].Zhonghua Jie He He Hu Xi Za Zhi. 2010 Oct;33(10):746-9. Zhonghua Jie He He Hu Xi Za Zhi. 2010. PMID: 21176505 Chinese.
-
Swine-origin influenza A (H1N1) viral infection: thoracic findings on CT.AJR Am J Roentgenol. 2011 Jun;196(6):W723-8. doi: 10.2214/AJR.10.5109. AJR Am J Roentgenol. 2011. PMID: 21606260 Review.
-
EMERGING PATHOGENS: INFLUENZA - H7N9.Dis Mon. 2017 Sep;63(9):251-256. doi: 10.1016/j.disamonth.2017.03.018. Epub 2017 Sep 12. Dis Mon. 2017. PMID: 29737282 Free PMC article. Review. No abstract available.
Cited by
-
Lower Respiratory Tract Infection of the Ferret by 2009 H1N1 Pandemic Influenza A Virus Triggers Biphasic, Systemic, and Local Recruitment of Neutrophils.J Virol. 2015 Sep;89(17):8733-48. doi: 10.1128/JVI.00817-15. Epub 2015 Jun 10. J Virol. 2015. PMID: 26063430 Free PMC article.
-
Case report: incidental findings of COVID-19 infection on positron emission tomography/computed tomography for staging of a giant gastric gastrointestinal stromal tumor.Pan Afr Med J. 2020 May 11;35(Suppl 2):28. doi: 10.11604/pamj.supp.2020.35.2.23167. eCollection 2020. Pan Afr Med J. 2020. PMID: 33623553 Free PMC article.
-
Nuclear Medicine in Times of COVID-19: How Radiopharmaceuticals Could Help to Fight the Current and Future Pandemics.Pharmaceutics. 2020 Dec 21;12(12):1247. doi: 10.3390/pharmaceutics12121247. Pharmaceutics. 2020. PMID: 33371500 Free PMC article. Review.
-
Innovations in modeling influenza virus infections in the laboratory.Trends Microbiol. 2012 Jun;20(6):275-81. doi: 10.1016/j.tim.2012.03.006. Epub 2012 Apr 19. Trends Microbiol. 2012. PMID: 22520511 Free PMC article. Review.
-
Molecular imaging reveals a progressive pulmonary inflammation in lower airways in ferrets infected with 2009 H1N1 pandemic influenza virus.PLoS One. 2012;7(7):e40094. doi: 10.1371/journal.pone.0040094. Epub 2012 Jul 20. PLoS One. 2012. PMID: 22911695 Free PMC article.
References
-
- Antonio GE, Ooi CG, Wong KT, et al. Radiographic-clinical correlation in severe acute respiratory syndrome: study of 1373 patients in Hong Kong. Radiology. 2005;237:1081–90. - PubMed
-
- Paul NS, Chung T, Konen E, et al. Prognostic significance of the radiographic pattern of disease in patients with severe acute respiratory syndrome. AJR Am J Roentgenol. 2004;182:493–8. - PubMed
-
- Qureshi NR, Hien TT, Farrar J, Gleeson FV. The radiologic manifestations of H5N1 avian influenza. J Thorac Imaging. 2006;21:259–64. - PubMed
-
- Aviram G, Bar-Shai A, Sosna J, et al. H1N1 influenza: initial chest radiographic findings in helping predict patient outcome. Radiology. 2010;255:252–9. - PubMed
-
- Semionov A, Tremblay C, Samson L, Chandonnet M, Chalaoui J, Chartrand-Lefebvre C. Pandemic influenza A (H1N1) 2009: chest radiographic findings from 147 proven cases in the Montreal area. Can Assoc Radiol J. 2010;61:233–40. - PubMed
Publication types
MeSH terms
LinkOut - more resources
Full Text Sources
Other Literature Sources
Medical
