

RasGrf1 deficiency delays aging in mice
- PMID: 21422498
- PMCID: PMC3091520
- DOI: 10.18632/aging.100279
RasGrf1 deficiency delays aging in mice
Abstract
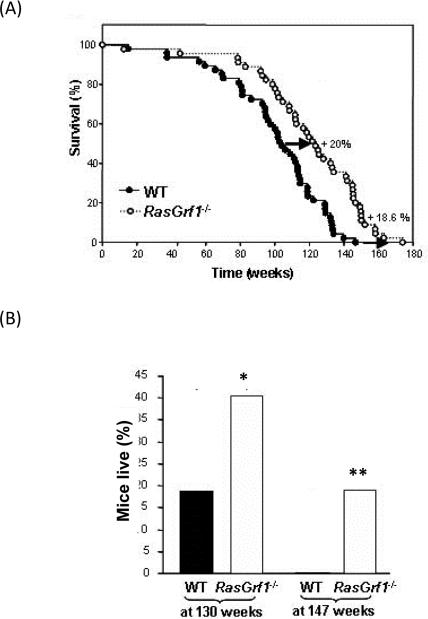
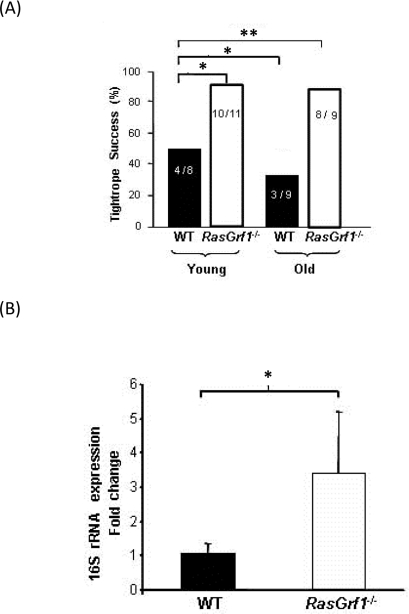
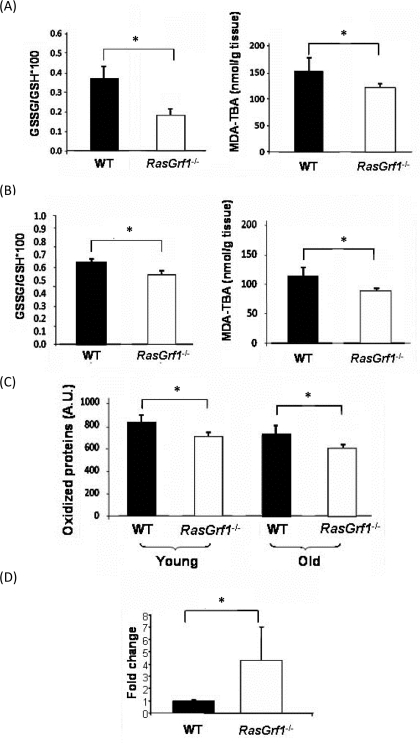
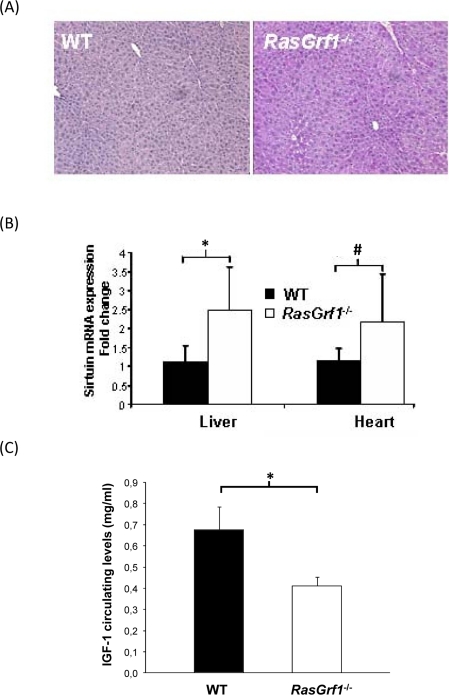
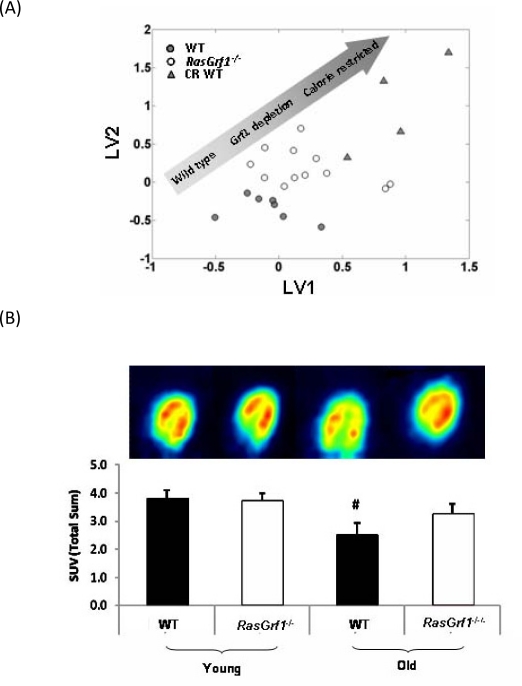
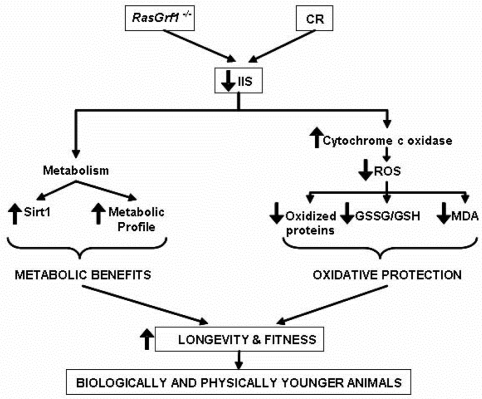
RasGRF1 is a Ras-guanine nucleotide exchange factor implicated in a variety of physiological processes including learning and memory and glucose homeostasis. To determine the role of RASGRF1 in aging, lifespan and metabolic parameters were analyzed in aged RasGrf1(-/-) mice. We observed that mice deficient for RasGrf1(-/-) display an increase in average and most importantly, in maximal lifespan (20% higher than controls). This was not due to the role of Ras in cancer because tumor-free survival was also enhanced in these animals. Aged RasGrf1(-/-) displayed better motor coordination than control mice. Protection against oxidative stress was similarly preserved in old RasGrf1(-/-). IGF-I levels were lower in RasGrf1(-/-) than in controls. Furthermore, SIRT1 expression was increased in RasGrf1(-/-) animals. Consistent with this, the blood metabolomic profiles of RasGrf1-deficient mice resembled those observed in calorie-restricted animals. In addition, cardiac glucose consumption as determined PET was not altered by aging in the mutant model, indicating that RasGrf1-deficient mice display delayed aging. Our observations link Ras signaling to lifespan and suggest that RasGrf1 is an evolutionary conserved gene which could be targeted for the development of therapies to delay age-related processes.
Conflict of interest statement
The authors of this manuscript have no conflict of interests to declare.
Figures
Comment in
-
A role for Ras signaling in modulating mammalian aging by the GH/IGF1 axis.Aging (Albany NY). 2011 Apr;3(4):336-7. doi: 10.18632/aging.100309. Aging (Albany NY). 2011. PMID: 21512206 Free PMC article. No abstract available.
-
RasGrf1 and aging.Aging (Albany NY). 2011 May;3(5):455. doi: 10.18632/aging.100331. Aging (Albany NY). 2011. PMID: 21666282 Free PMC article. No abstract available.
-
Conserved role of Ras-GEFs in promoting aging: from yeast to mice.Aging (Albany NY). 2011 Apr;3(4):340-3. doi: 10.18632/aging.100320. Aging (Albany NY). 2011. PMID: 21732566 Free PMC article. No abstract available.
Similar articles
-
Paternal genome effects on aging: evidence for a role of Rasgrf1 in longevity determination?Mech Ageing Dev. 2011 Jan-Feb;132(1-2):72-3. doi: 10.1016/j.mad.2010.11.004. Epub 2010 Dec 21. Mech Ageing Dev. 2011. PMID: 21182853
-
RasGrf1: genomic imprinting, VSELs, and aging.Aging (Albany NY). 2011 Jul;3(7):692-7. doi: 10.18632/aging.100354. Aging (Albany NY). 2011. PMID: 21765200 Free PMC article.
-
The Inhibition of RasGRF2, But Not RasGRF1, Alters Cocaine Reward in Mice.J Neurosci. 2019 Aug 7;39(32):6325-6338. doi: 10.1523/JNEUROSCI.1120-18.2019. Epub 2019 Jun 10. J Neurosci. 2019. PMID: 31182637 Free PMC article.
-
The RasGrf family of mammalian guanine nucleotide exchange factors.Biochim Biophys Acta. 2011 Apr;1815(2):170-88. doi: 10.1016/j.bbcan.2010.11.001. Epub 2010 Nov 25. Biochim Biophys Acta. 2011. PMID: 21111786 Review.
-
Calorie restriction and dwarf mice in gerontological research.Gerontology. 2010;56(4):404-9. doi: 10.1159/000235720. Epub 2009 Aug 19. Gerontology. 2010. PMID: 19690401 Review.
Cited by
-
Evidence that conserved essential genes are enriched for pro-longevity factors.Geroscience. 2022 Aug;44(4):1995-2006. doi: 10.1007/s11357-022-00604-5. Epub 2022 Jun 13. Geroscience. 2022. PMID: 35695982 Free PMC article.
-
Mesenchymal stem cell-derived inflammatory fibroblasts mediate interstitial fibrosis in the aging heart.J Mol Cell Cardiol. 2016 Feb;91:28-34. doi: 10.1016/j.yjmcc.2015.12.017. Epub 2015 Dec 22. J Mol Cell Cardiol. 2016. PMID: 26718722 Free PMC article. Review.
-
Replicative and chronological aging in Saccharomyces cerevisiae.Cell Metab. 2012 Jul 3;16(1):18-31. doi: 10.1016/j.cmet.2012.06.002. Cell Metab. 2012. PMID: 22768836 Free PMC article. Review.
-
MTOR-driven quasi-programmed aging as a disposable soma theory: blind watchmaker vs. intelligent designer.Cell Cycle. 2013 Jun 15;12(12):1842-7. doi: 10.4161/cc.25062. Epub 2013 Jun 12. Cell Cycle. 2013. PMID: 23708516 Free PMC article.
-
Big mice die young but large animals live longer.Aging (Albany NY). 2013 Apr;5(4):227-33. doi: 10.18632/aging.100551. Aging (Albany NY). 2013. PMID: 23603822 Free PMC article.
References
-
- Farnsworth CL, Freshney NW, Rosen LB, Ghosh A, Greenberg ME, Feig LA. Calcium activation of Ras mediated by neuronal exchange factor Ras-GRF. Nature. 1995;376:524–527. - PubMed
-
- Mattingly RR, Macara IG. Phosphorylation-dependent activation of the Ras-GRF/CDC25Mm exchange factor by muscarinic receptors and G-protein beta gamma subunits. Nature. 1996;382:268–272. - PubMed
-
- Shou C, Wurmser A, Suen KL, Barbacid M, Feig LA, Ling K. Differential response of the Ras exchange factor, Ras-GRF to tyrosine kinase and G protein mediated signals. Oncogene. 1995;10:1887–1893. - PubMed
-
- Santos E, Fernandez-Medarde A. Rasgrf1. UCSD-Nature Molecule Pages 2009 Published online. doi:10.1038/mp.a002032.01.
-
- Brambilla R, Gnesutta N, Minichiello L, White G, Roylance AJ, Herron CE, Ramsey M, Wolfer DP, Cestari V, Rossi-Arnaud C, Grant SG, Chapman PF, Lipp HP, Sturani E, Klein R. A role for the Ras signalling pathway in synaptic transmission and long-term memory. Nature. 1997;390:281–286. - PubMed
Publication types
MeSH terms
Substances
LinkOut - more resources
Full Text Sources
Medical
Molecular Biology Databases
