

Treatment of batch in the detection, calibration, and quantification of immunoassays in large-scale epidemiologic studies
- PMID: 21422966
- PMCID: PMC3073366
- DOI: 10.1097/EDE.0b013e3181dceac2
Treatment of batch in the detection, calibration, and quantification of immunoassays in large-scale epidemiologic studies
Abstract
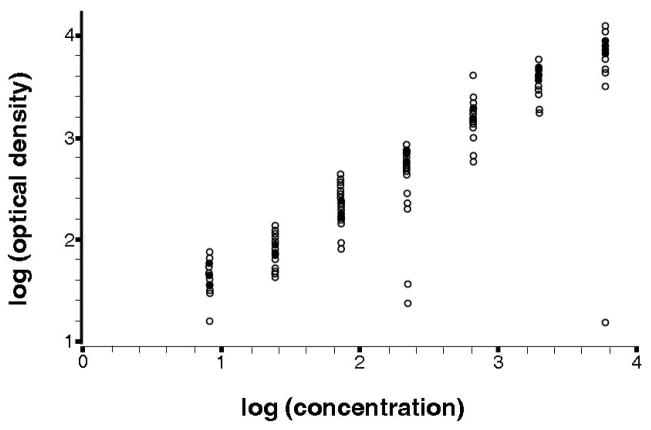
Many laboratory assays measure biomarkers via a 2-stage process. Direct measurement yields relative measures that are subsequently transformed to the unit of interest by using a calibration experiment. The calibration experiment is performed within the main experiment and uses a validation set for which true values are known and relative values are measured by assays to estimate the relation between relative and absolute values. Immunoassays, polymerase chain reaction, and chromatographic approaches are among assays performed in this manner.
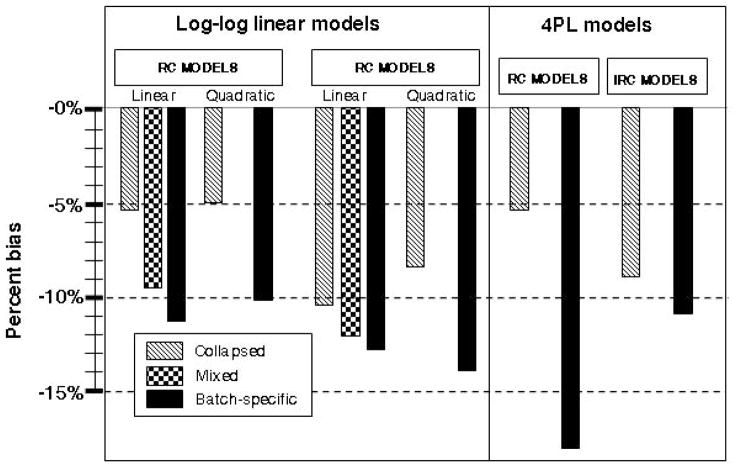
Methods: For studies with multiple batches, data from more than a single calibration experiment are available. Conventionally, calibration of assays based on the standard curve is performed specific to each batch; the calibration experiment from each batch is used to calibrate each batch independently. This batch-specific approach incorporates batch variability but, due to the small number of calibration measurements in each batch, may not be best suited for this purpose.
Results: Mixed-effects models have been described to address interassay variability and to provide a measure of quality assurance. Conversely, when interbatch variability is negligible, a model that does not incorporate batch effect may be used to estimate an overall calibration curve.
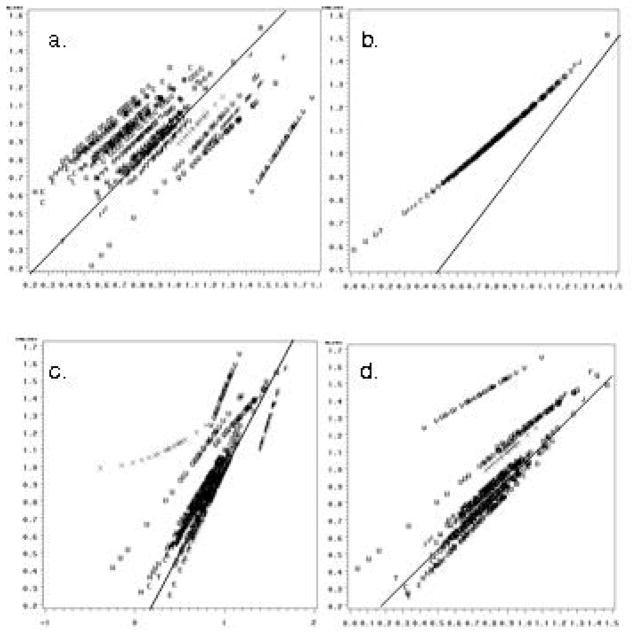
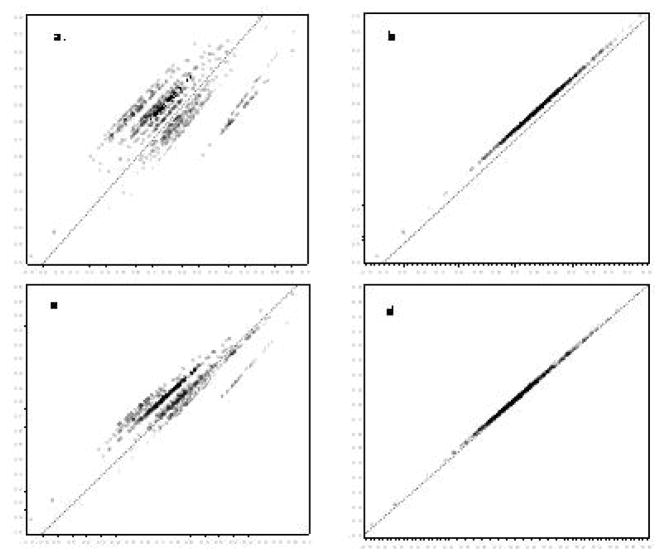
Conclusion: We explore approaches for use of calibration data in studies with many batches. Using a real data example with biomarker and outcome information, we show that risk estimates may vary depending on the calibration approach used. We demonstrate the potential for bias when using simulations. Under minimal interbatch variability, as seen in our data, conventional batch-specific calibration does not best use information available in the data and results in attenuated risk estimates.
Figures
References
-
- Rosner B, Spiegelman D, Willett WC. Correction of logistic regression relative risk estimates and confidence intervals for random within-person measurement error. Am J Epidemiol. 1992;136:1400–1413. - PubMed
-
- Rosner B, Spiegelman D, Willett WC. Correction of logistic regression relative risk estimates and confidence intervals for measurement error: the case of multiple covariates measured with error. Am J Epidemiol. 1990;132:734–745. - PubMed
-
- Helsel D. Nondetects and Data Analysis: Statistics for Censored Environmental Data. Hoboken, NJ: John Wiley & Sons, Inc; 2005.
-
- Liao JJ, Lewis JW. Qualifying ELISA data: combining information. J Biopharm Stat. 2000;10:545–558. - PubMed
Publication types
MeSH terms
Substances
Grants and funding
LinkOut - more resources
Full Text Sources
Other Literature Sources
