

Improved prediction of rates of visual field loss in glaucoma using empirical Bayes estimates of slopes of change
- PMID: 21423039
- PMCID: PMC3804256
- DOI: 10.1097/IJG.0b013e31820bd1fd
Improved prediction of rates of visual field loss in glaucoma using empirical Bayes estimates of slopes of change
Abstract
Purpose: To describe and test a new methodology for estimation of rates of progressive visual field loss in glaucoma.
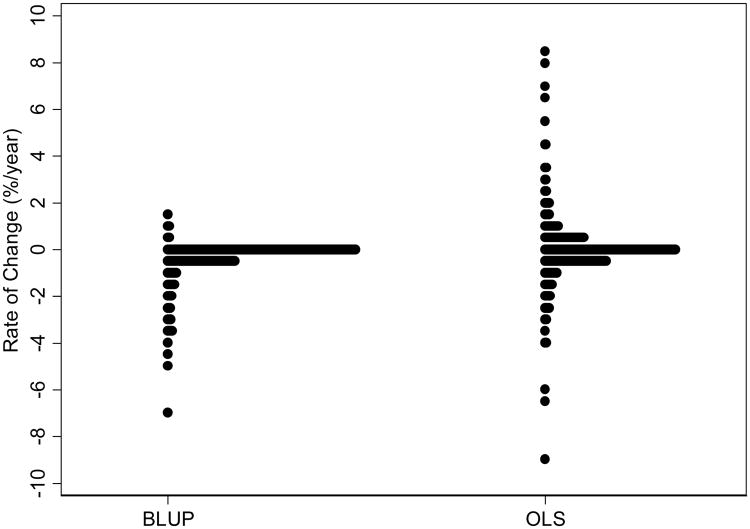
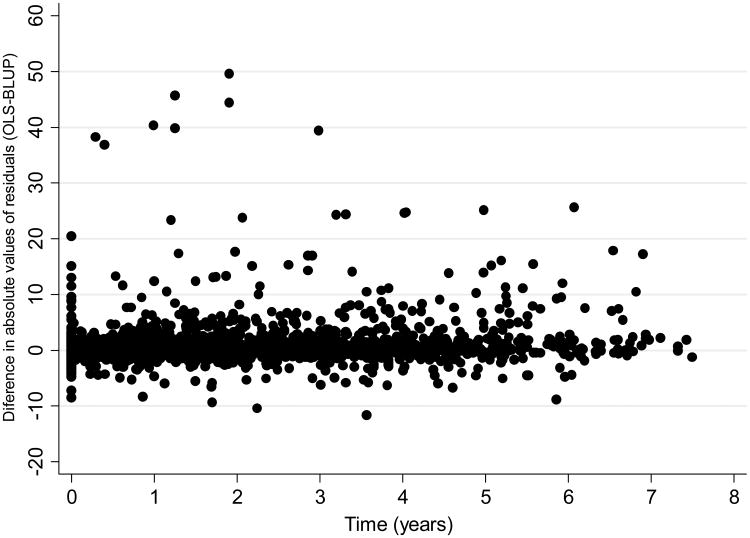
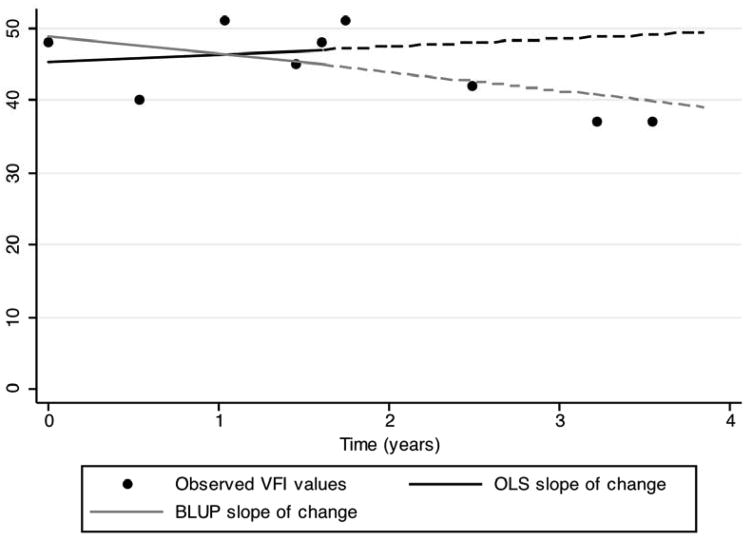
Methods: This observational cohort study enrolled 643 eyes of 368 patients recruited from the Diagnostic Innovations in Glaucoma Study, followed for an average of 6.5±2.0 years. The visual field index was used to evaluate degree of visual field loss in standard automated perimetry. Growth mixture models were used to evaluate visual field index changes over time. Empirical Bayes estimates of best linear unbiased predictions (BLUPs) were used to obtain slopes of change based on the first 5 visual fields for each eye. These slopes were then used to predict future observations. The same procedure was done for ordinary least squares (OLS) estimates. The mean square error of the predictions was used to compare the predictive performance of the different methods.
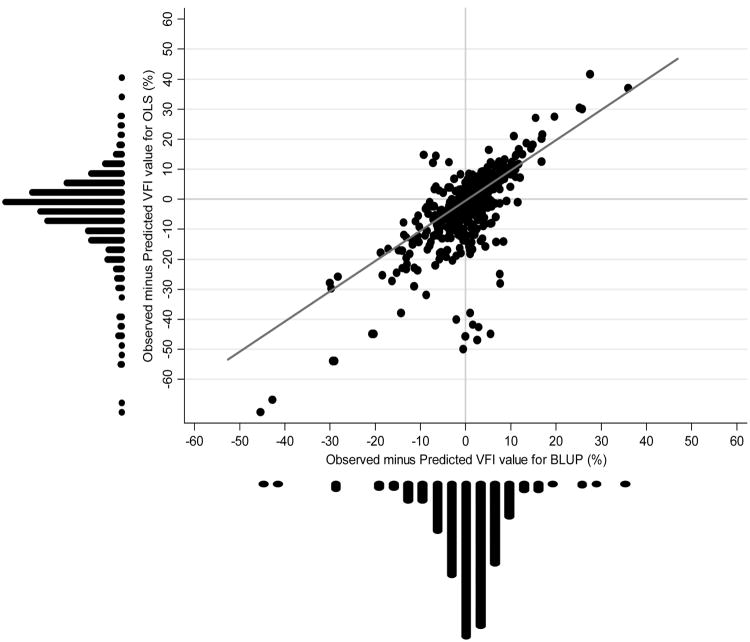
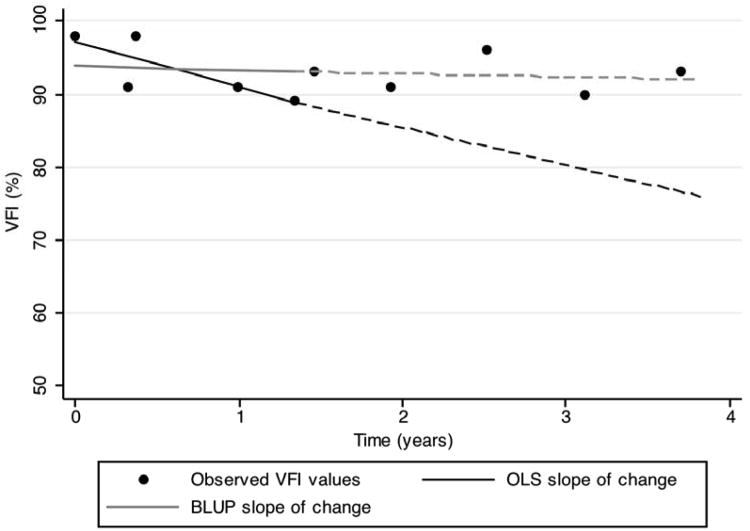
Results: The growth mixture model successfully identified subpopulations of nonprogressors, slow, moderate, and fast progressors. The mean square error was significantly higher for OLS compared with the BLUP method (32.3 vs 13.9, respectively; P<0.001), indicating a better performance of the BLUP method to predict future observations. The benefit of BLUP predictions was especially evident in eyes with moderate and fast rates of change.
Conclusions: Empirical Bayes estimates of rates of change performed significantly better than the commonly used technique of OLS regression in predicting future observations. Use of BLUP estimates should be considered when evaluating rates of functional change in glaucoma and predicting future impairment from the disease.
Figures
References
-
- Weinreb RN, Khaw PT. Primary open-angle glaucoma. Lancet. 2004 May 22;363(9422):1711–1720. - PubMed
-
- Anderson DR, Drance SM, Schulzer M. Natural history of normal-tension glaucoma. Ophthalmology. 2001 Feb;108(2):247–253. - PubMed
-
- See JL, Nicolela MT, Chauhan BC. Rates of neuroretinal rim and peripapillary atrophy area change: a comparative study of glaucoma patients and normal controls. Ophthalmology. 2009 May;116(5):840–847. - PubMed
-
- Bengtsson B, Heijl A. A visual field index for calculation of glaucoma rate of progression. Am J Ophthalmol. 2008 Feb;145(2):343–353. - PubMed
-
- Artes PH, Nicolela MT, LeBlanc RP, Chauhan BC. Visual field progression in glaucoma: total versus pattern deviation analyses. Invest Ophthalmol Vis Sci. 2005 Dec;46(12):4600–4606. - PubMed
Publication types
MeSH terms
Grants and funding
LinkOut - more resources
Full Text Sources
Medical
