. 2011 Apr;13(4):383-93.
doi: 10.1038/ncb2216. Epub 2011 Mar 20.

Analysis of the myosin-II-responsive focal adhesion proteome reveals a role for β-Pix in negative regulation of focal adhesion maturation

Affiliations

Analysis of the myosin-II-responsive focal adhesion proteome reveals a role for β-Pix in negative regulation of focal adhesion maturation

Jean-Cheng Kuo et al. Nat Cell Biol. 2011 Apr.

Abstract

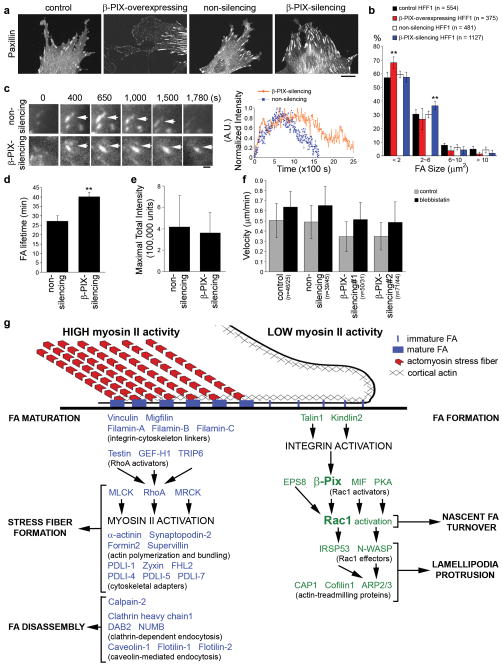
Focal adhesions undergo myosin-II-mediated maturation wherein they grow and change composition to modulate integrin signalling for cell migration, growth and differentiation. To determine how focal adhesion composition is affected by myosin II activity, we performed proteomic analysis of isolated focal adhesions and compared protein abundance in focal adhesions from cells with and without myosin II inhibition. We identified 905 focal adhesion proteins, 459 of which changed in abundance with myosin II inhibition, defining the myosin-II-responsive focal adhesion proteome. The abundance of 73% of the proteins in the myosin-II-responsive focal adhesion proteome was enhanced by contractility, including proteins involved in Rho-mediated focal adhesion maturation and endocytosis- and calpain-dependent focal adhesion disassembly. During myosin II inhibition, 27% of proteins in the myosin-II-responsive focal adhesion proteome, including proteins involved in Rac-mediated lamellipodial protrusion, were enriched in focal adhesions, establishing that focal adhesion protein recruitment is also negatively regulated by contractility. We focused on the Rac guanine nucleotide exchange factor β-Pix, documenting its role in the negative regulation of focal adhesion maturation and the promotion of lamellipodial protrusion and focal adhesion turnover to drive cell migration.


Figures

Fig. 1
Fig. 1. Development and validation of the FA isolation method
(a) Flow diagram for FA isolation from HFF1 cells and preparation for compositional identification by proteomic analysis. Intact HFF1 cells (top panel) and isolated HFF1 FAs (middle panel) that were immunostained to localize paxillin as an FA marker and F-actin (phalloidin). Scale bars = 20μm. (b) Histogram of the size distribution of segmented paxillin-containing FA from images of intact cells (n = 7 cells 1219 FA), hypotonically shocked cells (n = 7 cells 944 FA), and isolated FA (n = 9 cells, 1217 FA). Bars show SD. No significant differences were detected in the percentage of FA in each size range between FA in these three samples (native: 2.91+/−0.29μm2, hypotonic shock: 2.90+/−0.82 μm2, isolated: 2.94+/−0.57μm2). (c) Western blot comparison of protein concentration in total cell lysate (T), isolated FA fractions (F) (before immunodepletion) and cell body fractions (C) (equal total protein was loaded in each lane). The ratio shown on the right (F/C) (n= 3~4 experiments, +/−SD) indicates the relative concentration of protein compared between isolated FA fractions: cell body fractions. Note that this does not reflect the absolute amount of protein in isolated FA fractions and cell body fractions.
Fig. 2
Fig. 2. Proteome of isolated FAs
(a) Criteria applied to data from MudPIT MS analysis for assembling the detectable and reproducible lists of proteins present in isolated FA. (b) Venn diagram and classification of proteins identified in isolated FAs. Number of proteins in each class shown in parentheses. (c) Pie diagram showing the percentage of proteins from the reproducible list categorized according to function.
Fig. 3
Fig. 3. Development of the MyosinII Dependence Ratio to characterize the effects of myosinII inhibition on protein abundance in isolated FA
(a) Effects of myosinII inhibition by blebbistatin treatment (50μM, 2h) on the organization and morphology of FAs from intact cells or isolated FAs, visualized by immunostaining for paxillin. Scale bars = 20μm. (b) Histogram of the size distribution of segmented paxillin-containing FAs from images of intact blebbistatin-treated HFF1 cells (n = 3 cells 526 FAs) and isolated blebbistatin-treated FAs (n = 4 cells 252 FAs). Bars show SD. No significant differences were detected in the percentage of FAs in each size range between FAs from intact cells and isolated FAs. (c) Diagram of the procedure for calculating the MyosinII Dependence Ratio, representing the change in protein abundance in isolated FA between control and blebbistatin-treated cells.
Fig. 4
Fig. 4. Collective modulation by myosinII of the FA abundance of proteins in common biological pathways
(a) Number of proteins in different functional categories that exhibit change in abundance (relative to control) in isolated FA in response to blebbistatin treatment. Two-fold differences in abundance (MyosinII Dependence Ratio (MDR) <0.5 or >2) were considered high-confidence significant changes. (b)~(e) Proteins are represented by boxes that are color-coded according to the magnitude of their MyosinII Dependence Ratio (MDR) as in Supplemental Fig. S4. (b) MyosinII-mediated FA enrichment of proteins involved in FA maturation and stress fibers. (c) MyosinII modulation of FA proteins mediating integrin activation and actin linkage. (d) MyosinII-mediated FA enrichment of proteins involved in calpain-dependent and endocytosis-dependent FA disassembly (e) MyosinII-mediated FA reduction of proteins involved in Rac1 activation and lamellipodial actin treadmilling.
Fig. 5
Fig. 5. FA abundance of β-PIX is negatively regulated by myosinII-mediated maturation
(a) Western blot of isolated FA fractions from control and 50μM blebbistatin-treated cells (equal total protein loaded) with β-PIX antibodies. Fold enrichment in isolated FAs determined by western blot (Fold, n= 3 experiments,+/−SD) or MudPIT MS analysis (Fold in MS) indicated below. (b) TIRF images of immunolocalized paxillin (green) and β-PIX (purple) in control and 50μM blebbistatin-treated (blebb) cells. 6.5μm × 6.5μm boxed regions in left columns are magnified in the right three columns, scale bar = 1μm. (c) Ratio of average density of paxillin or β-PIX immunofluorescence signal (intensity/μm2) within segmented FAs of blebbistatin-treated relative to control cells (blebbistatin/control) or small (<2μm2) relative to big (>2μm2) FAs in control cells (small/big). n = 9 blebbistatin-treated cells, 9 control cells, Bars show SD, **, p<0.05. (d) Western blot with β-PIX antibodies of isolated FA fractions from cells plated on 1.5kPa and 55kPa substrates (equal total protein loaded). Fold enrichment in isolated FAs determined by western blot (Fold, n= 3 experiments, +/−SD) indicated below. (e) Images of immunolocalized paxillin (green) and β-PIX (purple) in cells plated on 1.5kPa and 55kPa substrates. 6.5μm × 6.5μm boxed regions in left columns are magnified in the right three columns, scale bar = 1μm. (f) Ratio of average density of paxillin or β-PIX immunofluorescence signal (intensity/μm2) within segmented FAs of cells plated on 1.5kPa relative to 55kPa. n = 6 cells plated on 1.5kPa substrates, 6 cells plated on 55kPa substrates, Bars show SD, **, p<0.05. (g) (left) Images from time-lapse dual-color TIRF series of eGFP-β-PIX and mApple-Paxillin. Time in seconds, scale bar = 1μm. (right) Normalized integrated fluorescence intensity (mApple-paxillin, red; eGFP-β-PIX, blue) and FA size (gray) over time in the FA marked with the arrow. (h) (left) Images from a time-lapse dual-color TIRF series of eGFP-β-PIX and mApple-paxillin during perfusion (at time= 0s) of Y27632 (10 μM) to inhibit ROCK-mediated myosinII activity. Blebbistatin could not be used because of its phototoxic effects in the presence of blue light. Time in seconds. Scale bar = 1 μm. (right) Normalized integrated fluorescence intensity (mApple-paxillin, blue; eGFP-β-PIX, orange) over time in the FAs in the boxed region.
Fig. 6
Fig. 6. Effects of β-Pix on regulation of lamellipodia formation and Rac1 activation
(a) GFP-β-PIX (red)-overexpressing HFF1 cells in treatment of 50 μM blebbistatin (2h) were immunostained for paxillin to localize nascent FA (green) and cortactin to localize protruding lamellipodia (blue). 6μm x 6μm boxed regions in left columns are magnified in the right and bottom three columns, scale bar = 1μm. (b) Cortactin (purple) and paxillin (green) immunostaining of HFF1 cells expressing non-silencing or β-PIX-silencing shRNA (same as β-PIX#1 in c) were treated with 50μM blebbistatin (blebbistatin) or not (control). Scale bar = 20μm. Right column shows ratio of cortactin-stained cell area relative to total cell area for cells under conditions described above. n=10 cells, +/−SD. **, p<0.05. (c) Effects of β-PIX-silencing on blebbistatin-induced Rac1 activation. HFF1 cells expressing non-silencing (non) or β-PIX-silencing shRNA (β-PIX#1 and β-PIX#2 indicate different sequence targets of β-Pix shRNA) alone or together with myc-tagged mouse β-Pix (myc-β-PIX) were treated with 50 μM blebbistatin for 2 hr (blebb) or not and cell lysates prepared. Level of GTP-bound Rac1 (GTP-Rac) isolated from lysates by GST-PAK-CRIB pull-down was detected by western blot. Protein level of Rac1 (Total Rac), β-PIX and tubulin in the input lysate detected by western blot. Change relative to control in levels of GTP-Rac and β-PIX determined by western blot (Fold) indicated below.
Fig. 7
Fig. 7. Effects of β-PIX on FA dynamics and cell migration
(a) Paxillin immunostaining of FAs in control, GFP-β-Pix-overexpressing, non-silencing shRNA-expressing, or β-Pix-silencing (same as β-PIX#1 in Fig. 7c) shRNA-expressing cells. Scale bar = 20 μm. (b) Histogram of size distribution of segmented FAs in the periphery (within 15μm for the cell edge) under conditions described in (a). n= number of FAs. Bars show SD. **, p<0.05. (c) (left) Images from a time-lapse TIRF series of mApple-paxillin during FA turnover in a migrating cell that was expressing non-silencing or β-Pix-silencing (same as β-PIX#1 in Fig. 7c) shRNAs. Scale bar = 1 μm. (right) Normalized fluorescent paxillin intensity over time in the FAs highlighted with arrows. (d) Mean FA lifetime (β-PIX silenced: 40.19±2.38min, control: 27.11±3.00min) and (e) maximal total intensity of mApple-paxillin in FAs under conditions described in (c) (in d and e, non-silencing: n = 19 FAs/5 cells; β-Pix-silencing: n = 15 FAs/6 cells, bars show SD), ** p<0.05. (f) Migration velocity of cells expressing either non-silencing or β-Pix-silencing HFF1 shRNAs with or without 50 μM blebbistatin treatment. n=number of control cells/number of blebbistatin-treated cells, bars show SD. (g) Model of the effects of myosinII contractility on the composition and function of FAs in the leading edge.

Comment in

References

    1. Burridge K, Fath K, Kelly T, Nuckolls G, Turner C. Focal adhesions: transmembrane junctions between the extracellular matrix and the cytoskeleton. Annu Rev Cell Biol. 1988;4:487–525. - PubMed
    1. Hynes RO. Integrins: bidirectional, allosteric signaling machines. Cell. 2002;110:673–687. - PubMed
    1. Zaidel-Bar R, Itzkovitz S, Ma’ayan A, Iyengar R, Geiger B. Functional atlas of the integrin adhesome. Nat Cell Biol. 2007;9:858–867. - PMC - PubMed
    1. Zamir E, Geiger B, Kam Z. Quantitative multicolor compositional imaging resolves molecular domains in cell-matrix adhesions. PLoS One. 2008;3:e1901. - PMC - PubMed
    1. Bershadsky A, Kozlov M, Geiger B. Adhesion-mediated mechanosensitivity: a time to experiment, and a time to theorize. Curr Opin Cell Biol. 2006;18:472–481. - PubMed

Publication types

MeSH terms