. 2011 Apr;13(4):423-33.
doi: 10.1038/ncb2210. Epub 2011 Mar 20.

MicroRNAs are transported in plasma and delivered to recipient cells by high-density lipoproteins

Affiliations

MicroRNAs are transported in plasma and delivered to recipient cells by high-density lipoproteins

Kasey C Vickers et al. Nat Cell Biol. 2011 Apr.

Erratum in

  • Nat Cell Biol. 2015 Jan;17(1):104

Abstract

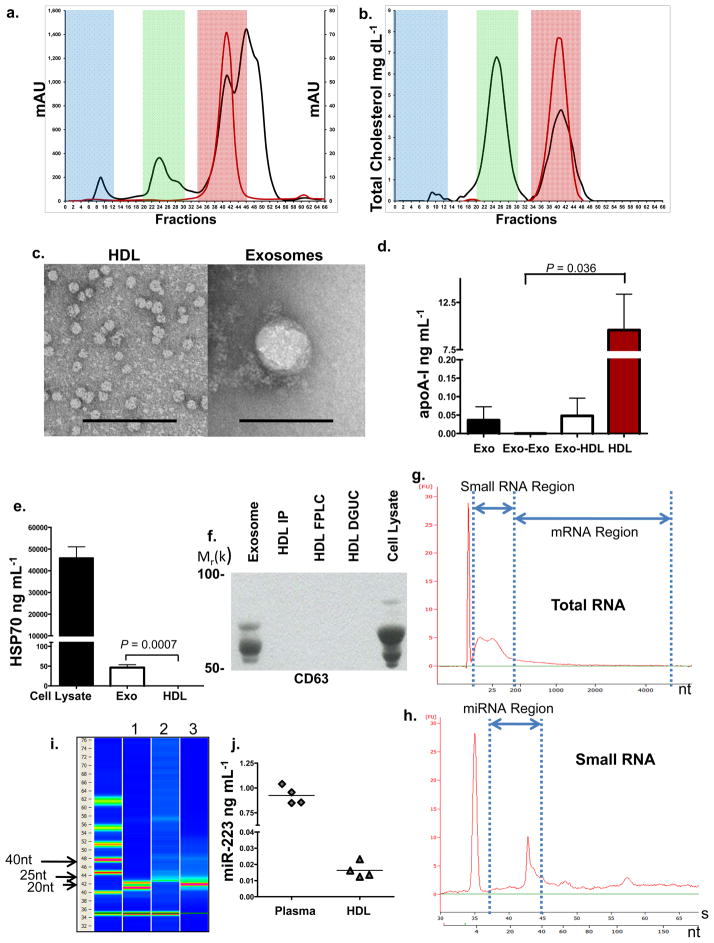
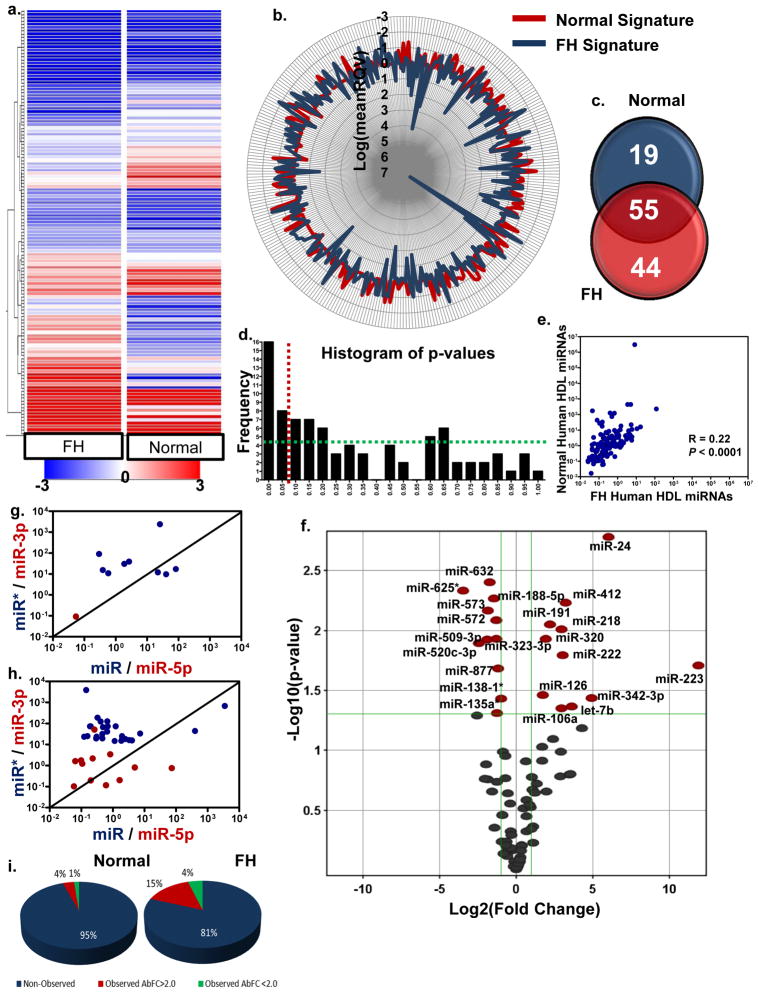
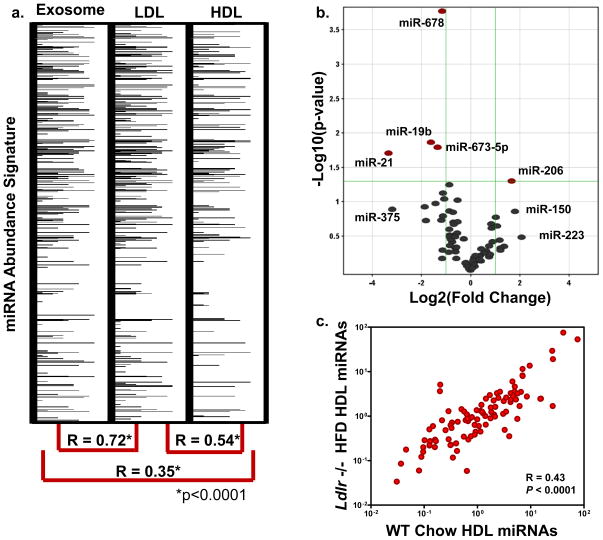
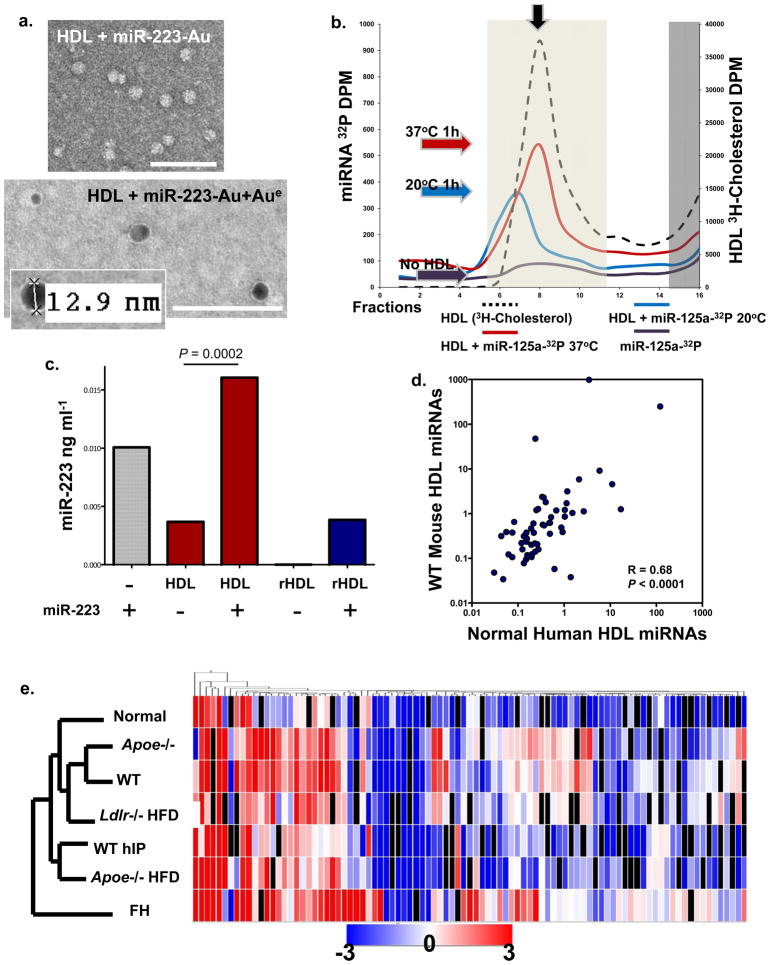
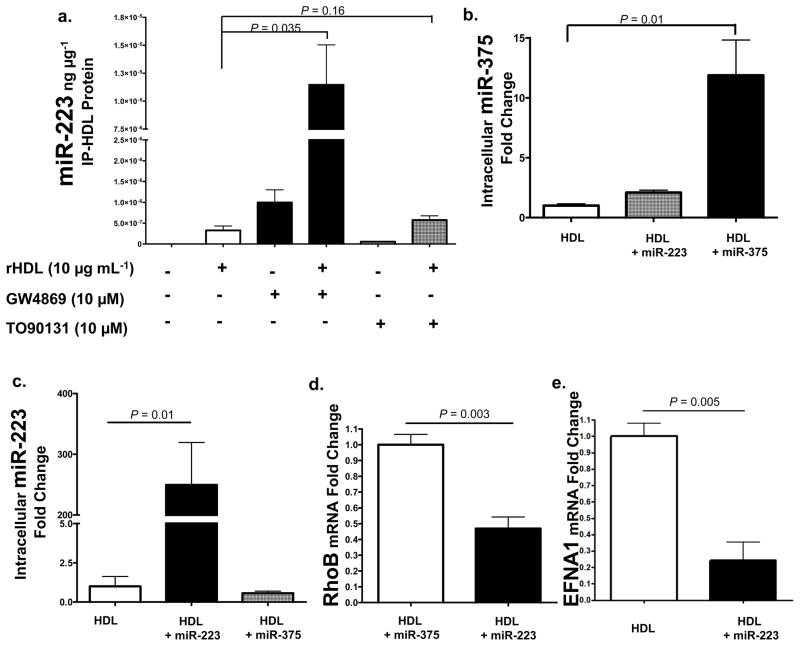
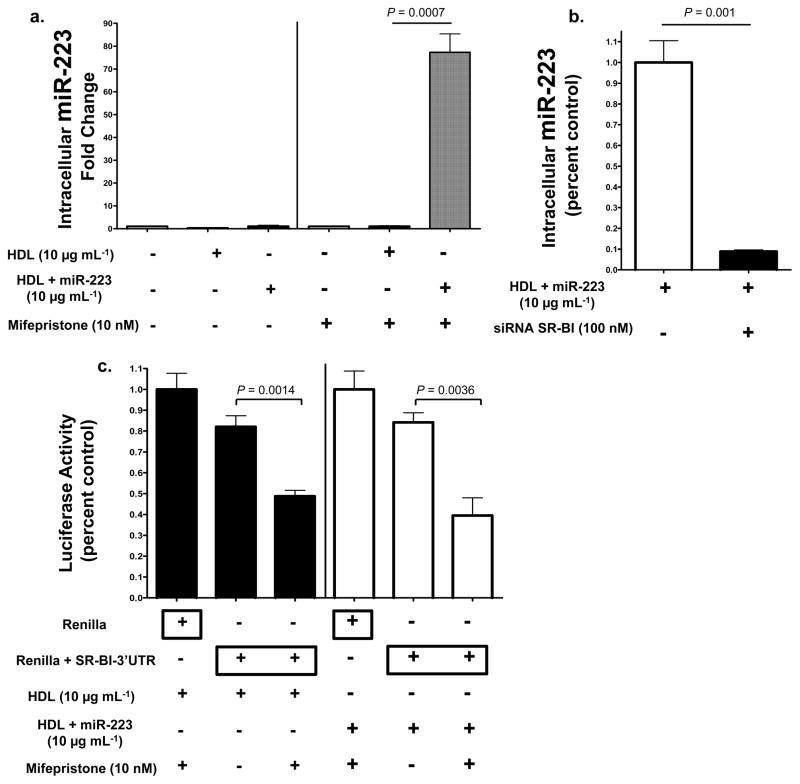
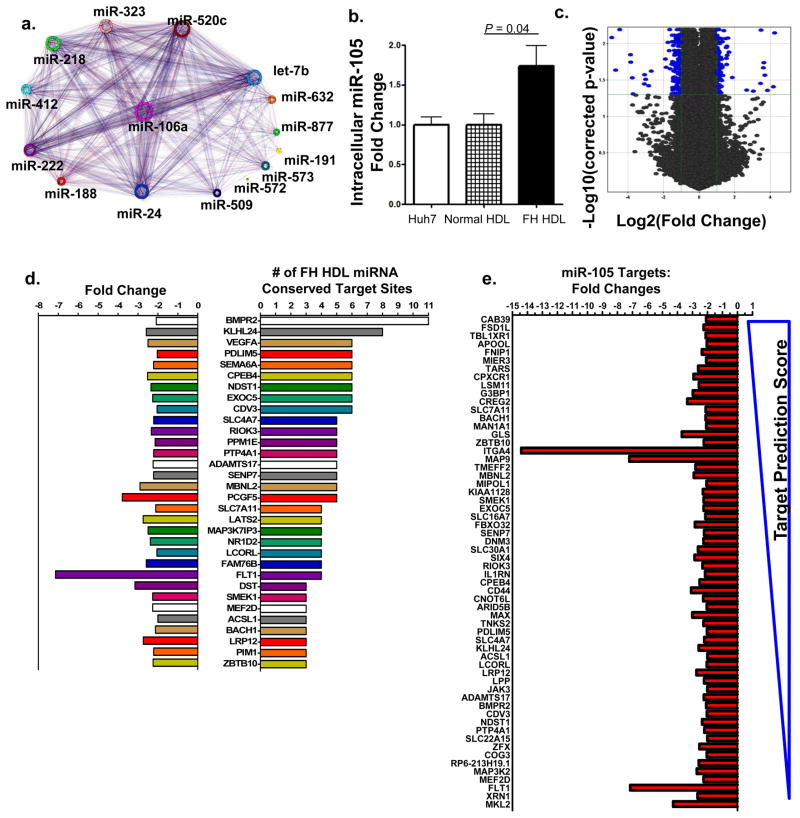
Circulating microRNAs (miRNA) are relatively stable in plasma and are a new class of disease biomarkers. Here we present evidence that high-density lipoprotein (HDL) transports endogenous miRNAs and delivers them to recipient cells with functional targeting capabilities. Cellular export of miRNAs to HDL was demonstrated to be regulated by neutral sphingomyelinase. Reconstituted HDL injected into mice retrieved distinct miRNA profiles from normal and atherogenic models. HDL delivery of both exogenous and endogenous miRNAs resulted in the direct targeting of messenger RNA reporters. Furthermore, HDL-mediated delivery of miRNAs to recipient cells was demonstrated to be dependent on scavenger receptor class B type I. The human HDL-miRNA profile of normal subjects is significantly different from that of familial hypercholesterolemia subjects. Notably, HDL-miRNA from atherosclerotic subjects induced differential gene expression, with significant loss of conserved mRNA targets in cultured hepatocytes. Collectively, these observations indicate that HDL participates in a mechanism of intercellular communication involving the transport and delivery of miRNAs.


Conflict of interest statement

COMPETING FINANCIAL INTERESTS

The authors declare no competing financial interests.

Figures

Figure 1
Figure 1. HDL RNA Analysis
a.) Human plasma and HDL FPLC protein distribution (mAU). Red shading, HDL; green shading, LDL; and blue shading, VLDL-exosome. Black line, human plasma; red line, purified HDL. b.) Human plasma and HDL FPLC total cholesterol distribution (mg dL−1). Black line, plasma; red line, purified HDL. c.) TEM of HDL and exosomes, Scale bar = 100 nm. d.) Quantification of ApoA-I (ng mL−1) protein. Exo, exosomes (n=3); Exo-Exo, FPLC exosome zone from total exosome preparations (n=3); Exo-HDL, FPLC HDL zone from total exosome preparations (n=4); HDL, purified from plasma (n=5). Data are means +/− s.e.m. e.) Quantification of HSP70 protein (ng mL−1), Huh7 cell lysates (n=4); Exo, exosomes (n=4); and HDL, purified from plasma (n=4). Data are means +/− s.e.m. f.) Western blot, Anti-CD63. Purified exosomes; HDL IP, HDL immunoprecipitation; HDL FPLC; HDL DGUC, HDL density-gradient ultracentrifugation; Huh7 cell lysate. Uncropped image of blot (Fig. S6) g.) Bioanalyzer Pico analysis of HDL total RNA. h.) Bioanalyzer Small RNA analysis of HDL total RNA. i.) Digital gel electrophoresis of HDL small RNAs. Lane 1, miRNA standards 22 & 25 nts; Lane 2, HDL total RNA; Lane 3, miR-223 positive control. j.) Quantification of hsa-miR-223 levels (ng mL−1). n=4.
Figure 2
Figure 2. Human HDL carries distinct miRNA signatures in health and disease
a.) Hierarchal clustering heatmap of human HDL miRNAs from normal (n=6) and FH (familial hypercholesterolemia) (n=5) subjects. Blue to red, color range gradient of mean abundance (−3 to 3). b.) StarGlyph distribution of each miRNA observed on HDL. Log values of the mean RQV (relative quantitative value). Red, normal; blue, FH HDL. c.) Venn diagram of normal and FH HDL miRNA totals. miRNA must be observed on ≥ 3 arrays within class. d.) Histogram of frequency distribution of p-values. Red line, P=0.05. Green line illustrates uniform distribution of p-values. e.) Spearman non-parametric correlation between normal and FH HDL miRNA profiles. f.) Volcano plot of significant differentially abundant miRNAs on FH HDL compared to normal HDL. Red marks, >2-fold change (Log2); P<0.05 (−Log10). g.) Expression (mean) ratios of miRNA pairs (miR/miR*, blue; miR-5p/miR-3p, red). Black line represents expression ratio of 1 (x=y) and similar abundance of both strands of pairs. Log10 scale. g.) Human HDL-miRNA pairs from normal subjects h.) Human HDL-miRNA pairs from FH subjects. i.) Pie charts illustrating strand observations (percentages) for normal (left) and FH (right) HDL. Blue, ≤1 strand of miRNA pair was observed; red, both strands of miRNA pair was observed but absolute fold change (AbFC) >2.0; green, both strands of pair were observed and had relatively equal abundance (AbFC<2.0).
Figure 3
Figure 3. The role of LDL and the LDL receptor in HDL-miRNA signatures
a.) miRNA abundance signatures of human exosomes, LDL, and HDL from same subject. Spearman non-parametric correlation between each profile. *p<0.0001. miRNAs are numerically ranked top-down and abundances are represented by horizontal band intensity. b.) Volcano plot of significant (P<0.05) differential (>2.0-fold) HDL-miRNA abundances in Ldlr −/− HFD mice (n=3) compared to WT controls (n=3). Red marks, >2-fold change (Log2); P<0.05 (−Log10). c.) Spearman non-parametric correlation between Ldlr −/− HFD mice and WT controls. R=0.43, P<0.0001.
Figure 4
Figure 4. HDL readily incorporates with miRNAs in vitro and in vivo
a) TEM image of HDL + Nanogold-labeled miRNA (miR-223-Au) unenhanced (Top); HDL + Nanogold-labeled miRNA (miR-223-Au) gold enhanced (Aue) (2 min) (Bottom). Scale bars = 100 nm. b.) FPLC separation of radiolabeled HDL (3H-cholesterol) -miRNA (32P-miR-125a) complexes. Red line, HDL + 32P-miR-125a (37°C reaction); blue line, HDL + 32P-miR-125a (20°C reaction); purple line, 32P-miR-125a alone; black dash line, 3H-HDL + cold miR-125a. Light shading indicates HDL complex zone, dark shading indicates uncomplexed free radiolabeled 32P-miR-125a and 3H-HDL zone. Colored arrows indicate peak associations, red (37°C), blue (20°C), purple (no HDL). S200 Column. c.) Quantification of HDL-miR-223 incorporation. hsa-miR-223 (ng ml−1) levels post-HDL-IP, miR-223, positive control; native human HDL; native human HDL + miR-223; reconstituted HDL (rHDL); rHDL + miR-223. n=2 d.) Spearman non-parametric correlation between WT mouse and normal human HDL profiles. R=0.68, P<0.0001. e.) Hierarchal clustering heatmap of HDL-miRNA profiles (mean) in wellness, hyperlipidemia, and atherosclerosis (mouse & human). n=7 conditions: FH, familial hypercholesterolemia (n=5); Apoe−/− HFD (n=4); WT hIP (n=3), rHDL retrieved from wild-type (WT) mice (n=3); Ldlr −/− HFD (n=3); WT chow diet (n=3); Apoe−/− chow diet (n=3); and Normal human HDL (n=6).
Figure 5
Figure 5. HDL transfers miRNAs to recipient cells with functional targeting
a.) nSMase2 regulates miRNA export to HDL. Quantification of HDL-miR-223 levels (qPCR) normalized to IP-rHDL protein (ng μg−1). rHDL, reconstituted HDL. GW4869, chemical inhibitor of nSMase2; TO90131, LXRα agonist induces ABCA1 expression. n=3. Data are means +/− s.e.m. b.) Quantification of intracellular miR-375 levels (qPCR) in hepatocytes (Huh7) treated with HDL (80 μg mL−1) alone (n=4), HDL+miR-223 (80 μg mL−1) (n=4), or HDL+miR-375 (80 μg mL−1) (n=4). Data are means +/− s.e.m. c.) Quantification of intracellular miR-223 levels (qPCR) in hepatocytes (Huh7) treated with HDL alone (80 μg mL−1) (n=4), HDL+miR-223 (80 μg mL−1) (n=4), or HDL+miR-375 (80 μg mL−1) (n=4). Data are means +/− s.e.m. d.) Quantification of RhoB mRNA levels (fold change) in hepatocytes (Huh7) treated with HDL+miR-375 (80 μg mL−1) (n=4) or HDL+miR-223 (80 μg mL−1) (n=4). Data are means +/− s.e.m. e.) Quantification of Ephrin A1 mRNA levels (fold change) in hepatocytes (Huh7) treated with HDL alone (80 μg mL−1) (n=3) or HDL+miR-223 (80 μg mL−1) (n=3). Data are means +/− s.e.m.
Figure 6
Figure 6. HDL-miRNA delivery is SR-BI-dependent
a.) Quantification of intracellular hsa-miR-223 levels (fold change). Transfected BHK cells, pSwitch human SR-BI inducible (mifepristone 10 nM) expression system, treated with HDL alone (10 μg mL−1) (n=3) or HDL+miR-223 (10 μg mL−1) (n=3). Data are means +/− s.e.m. b.) Quantification of HDL-miR-223 delivery, as determined by intracellular miR-223 levels (qPCR, miR-223 standard curve). Data reported as percent control. Human hepatocytes (Huh7) transfected with SR-BI siRNA (100 nM, On-target Plus pool) (n=3) or mock reagent (n=3), prior to HDL+miR-223 (10 μg mL−1) treatment. Data are means +/− s.e.m. c.) Renilla luciferase activity normalized to Firefly (transfection control) luciferase activity. BHK cells transfected with pSwitch human SR-BI inducible (mifepristone 10 nM) expression system treated with HDL (80 μg mL−1) (n=4) or HDL+miR-223 (80 μg mL−1) (n=4). Renilla-SR-BI-3′UTR luciferase reporter activities reported as fold changes to Renilla controls. Data are means +/− s.e.m.
Figure 7
Figure 7. Atherosclerotic HDL induces differential gene expression through miRNA transfer
a.) Conceptualization of FH HDL-miRNA mRNA target interactome. Putative targets of differentially abundant FH HDL-miRNAs (unique colors) and their association to other miRNAs and targets b.) Quantification of intracellular (Huh7) hsa-miR-105 (fold change) after human FH (n=4) or normal (n=4) HDL (80 μg mL−1) delivery. Data are means +/− s.e.m. c.) Volcano plot illustrating significant differential gene expression (mRNA) changes (blue marks) attributed to FH HDL-miRNA delivery, compared to normal HDL. −Log10 (Benjamini-Hochberg corrected p-value) p<0.05; Log2 (fold change) >2-fold. n=3. d.) Down-regulated genes (32) due to FH HDL-miRNA delivery with ≥ 3 predicted target sites of differential FH HDL-miRNAs. Left, negative fold changes; right, number of FH HDL-miRNA conserved target sites within mRNA 3′UTRs. e.) Down-regulated genes (60) due to FH HDL-miRNA delivery that are putative targets of FH HDL specific hsa-miR-105. Predicted targeting score (TargetScan) range (−0.89 top to 0.04 bottom). n=3.

Similar articles

Cited by

References

    1. Simons M, Raposo G. Exosomes--vesicular carriers for intercellular communication. Curr Opin Cell Biol. 2009;21:575–581. - PubMed
    1. Valadi H, et al. Exosome-mediated transfer of mRNAs and microRNAs is a novel mechanism of genetic exchange between cells. Nat Cell Biol. 2007;9:654–659. - PubMed
    1. Hunter MP, et al. Detection of microRNA expression in human peripheral blood microvesicles. PLoS One. 2008;3:e3694. - PMC - PubMed
    1. Ratajczak J, Wysoczynski M, Hayek F, Janowska-Wieczorek A, Ratajczak MZ. Membrane-derived microvesicles: important and underappreciated mediators of cell-to-cell communication. Leukemia. 2006;20:1487–1495. - PubMed
    1. Selbach M, et al. Widespread changes in protein synthesis induced by microRNAs. Nature. 2008;455:58–63. - PubMed

Publication types