

N-cadherin and integrin blockade inhibit arteriolar myogenic reactivity but not pressure-induced increases in intracellular Ca
- PMID: 21423400
- PMCID: PMC3059933
- DOI: 10.3389/fphys.2010.00165
N-cadherin and integrin blockade inhibit arteriolar myogenic reactivity but not pressure-induced increases in intracellular Ca
Abstract
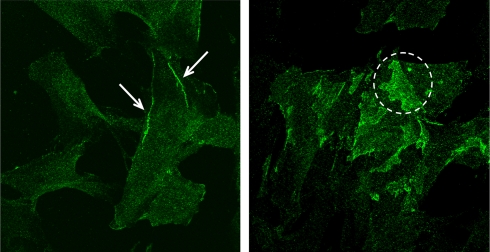
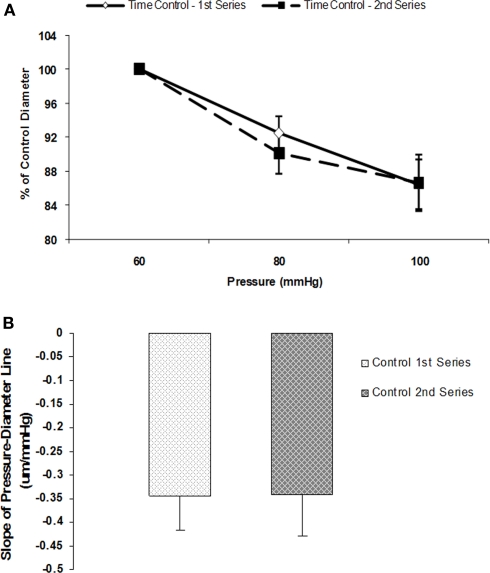
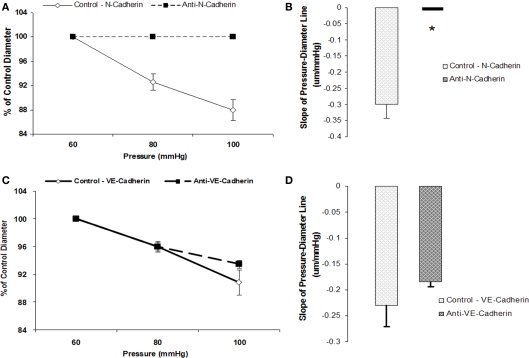
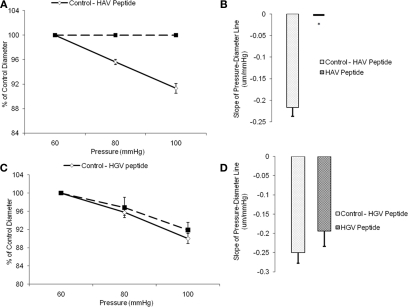
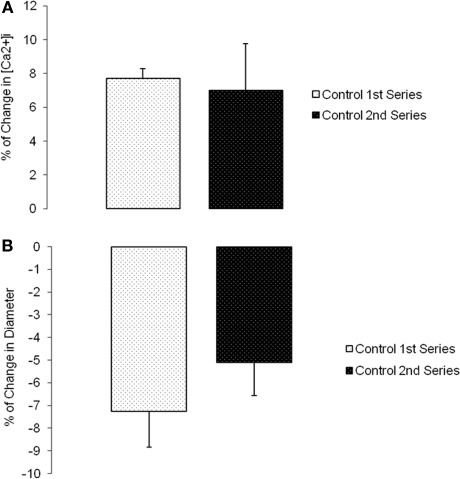
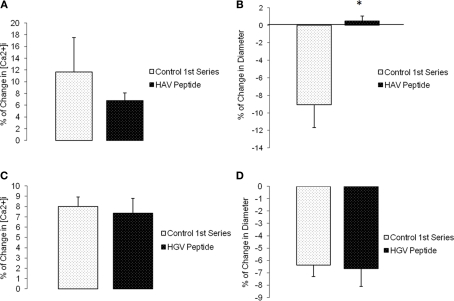
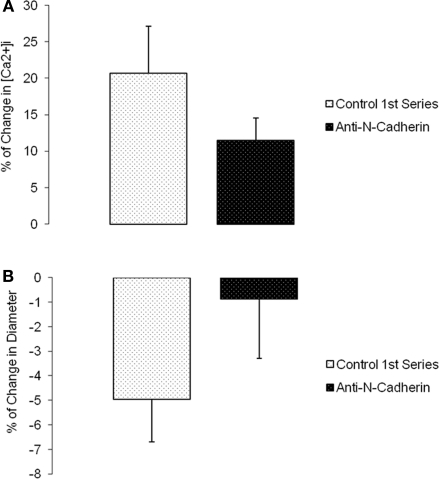
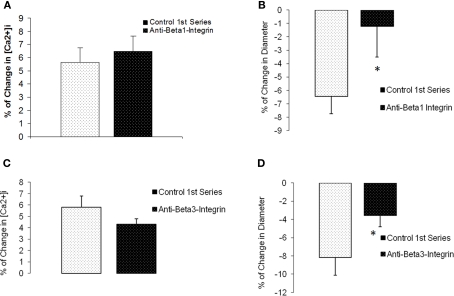
The vascular myogenic response is characterized by arterial constriction in response to an increase in intraluminal pressure and dilatation to a decrease in pressure. This mechanism is important for the regulation of blood flow, capillary pressure, and arterial pressure. The identity of the mechanosensory mechanism(s) for this response is incompletely understood but has been shown to include the integrins as cell-extracellular matrix receptors. The possibility that a cell-cell adhesion receptor is involved has not been studied. Thus, we tested the hypothesis that N-cadherin, a cell-cell adhesion molecule in vascular smooth muscle cells (VSMCs), was important for myogenic responsiveness. The purpose of this study was to investigate: (1) whether cadherin inhibition blocks myogenic responses to increases in intraluminal pressure and (2) the effect of the cadherin or integrin blockade on pressure-induced changes in [Ca(2+)]i. Cadherin blockade was tested in isolated rat cremaster arterioles on myogenic responses to acute pressure steps from 60 to 100 mmHg and changes in VSMC Ca(2+) were measured using fura-2. In the presence of a synthetic cadherin inhibitory peptide or a function-blocking antibody, myogenic responses were inhibited. In contrast, during N-cadherin blockade, pressure-induced changes in [Ca(2+)]i were not altered. Similarly, vessels treated with function-blocking β1- or β3-integrin antibodies maintained pressure-induced [Ca(2+)]i responses despite inhibition of myogenic constriction. Collectively, these data suggest that both cadherins and integrins play a fundamental role in mediating myogenic constriction but argue against their direct involvement in mediating pressure-induced [Ca(2+)]i increases.
Keywords: cadherins; cell adhesion; integrins; mechanosensors; mechanotransduction; microcirculation; myogenic response; vascular smooth muscle.
Figures
Similar articles
-
N-Cadherin, a novel and rapidly remodelling site involved in vasoregulation of small cerebral arteries.J Physiol. 2017 Mar 15;595(6):1987-2000. doi: 10.1113/JP272995. Epub 2017 Feb 7. J Physiol. 2017. PMID: 28008617 Free PMC article.
-
Lysophosphatidic acid induces integrin activation in vascular smooth muscle and alters arteriolar myogenic vasoconstriction.Front Physiol. 2014 Oct 31;5:413. doi: 10.3389/fphys.2014.00413. eCollection 2014. Front Physiol. 2014. PMID: 25400583 Free PMC article.
-
Tyrosine phosphorylation modulates arteriolar tone but is not fundamental to myogenic response.Am J Physiol Heart Circ Physiol. 2000 Feb;278(2):H373-82. doi: 10.1152/ajpheart.2000.278.2.H373. Am J Physiol Heart Circ Physiol. 2000. PMID: 10666067
-
Cellular signalling in arteriolar myogenic constriction: involvement of tyrosine phosphorylation pathways.Clin Exp Pharmacol Physiol. 2002 Jul;29(7):612-9. doi: 10.1046/j.1440-1681.2002.03698.x. Clin Exp Pharmacol Physiol. 2002. PMID: 12060106 Review.
-
Ion channels and myogenic activity in retinal arterioles.Curr Top Membr. 2020;85:187-226. doi: 10.1016/bs.ctm.2020.01.008. Epub 2020 Feb 26. Curr Top Membr. 2020. PMID: 32402639 Review.
Cited by
-
The role of mechanotransduction on vascular smooth muscle myocytes' [corrected] cytoskeleton and contractile function.Anat Rec (Hoboken). 2014 Sep;297(9):1758-69. doi: 10.1002/ar.22983. Anat Rec (Hoboken). 2014. PMID: 25125187 Free PMC article. Review.
-
N-Cadherin, a novel and rapidly remodelling site involved in vasoregulation of small cerebral arteries.J Physiol. 2017 Mar 15;595(6):1987-2000. doi: 10.1113/JP272995. Epub 2017 Feb 7. J Physiol. 2017. PMID: 28008617 Free PMC article.
-
3D confinement alters smooth muscle cell responses to chemical and mechanical cues.APL Bioeng. 2024 Oct 25;8(4):046103. doi: 10.1063/5.0225569. eCollection 2024 Dec. APL Bioeng. 2024. PMID: 39464377 Free PMC article.
-
Regulation of blood flow in small arteries: mechanosensory events underlying myogenic vasoconstriction.J Exerc Rehabil. 2020 Jun 30;16(3):207-215. doi: 10.12965/jer.2040432.216. eCollection 2020 Jun. J Exerc Rehabil. 2020. PMID: 32724777 Free PMC article. Review.
-
Arteriolar vascular smooth muscle cells: mechanotransducers in a complex environment.Int J Biochem Cell Biol. 2012 Sep;44(9):1505-10. doi: 10.1016/j.biocel.2012.05.021. Epub 2012 Jun 5. Int J Biochem Cell Biol. 2012. PMID: 22677491 Free PMC article. Review.
References
-
- Avizienyte E., Wyke A. W., Jones R. J., McLean G. W., Westhoff M. A., Brunton V. G., Frame M. C. (2002). Src-induced de-regulation of E-cadherin in colon cancer cell requires integrin signaling. Nat. Cell Biol. 4, 632–638 - PubMed
-
- Brunton V. G., MacPherson I. R., Frame M. C. (2004). Cell adhesion receptors, tyrosine kinases and actin modulators: a complex three-way circuitry. Biochim. Biophys. Acta 1692, 121–144 - PubMed
Grants and funding
LinkOut - more resources
Full Text Sources
Research Materials
Miscellaneous