

Control of GABA Release at Mossy Fiber-CA3 Connections in the Developing Hippocampus
- PMID: 21423487
- PMCID: PMC3059712
- DOI: 10.3389/neuro.19.001.2010
Control of GABA Release at Mossy Fiber-CA3 Connections in the Developing Hippocampus
Abstract
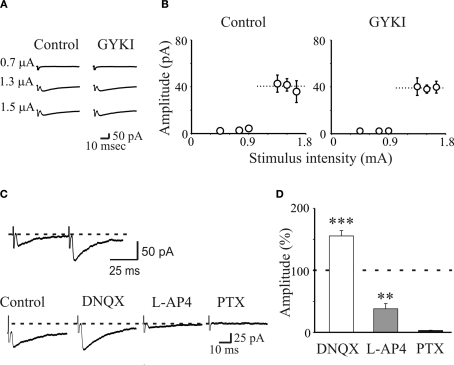
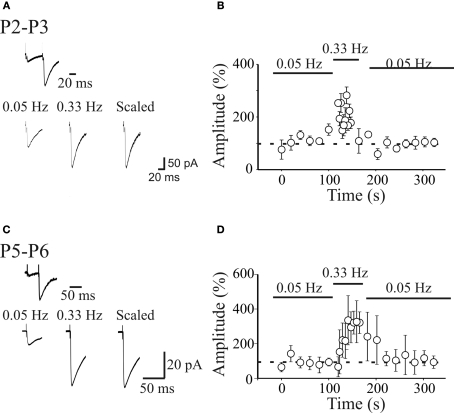
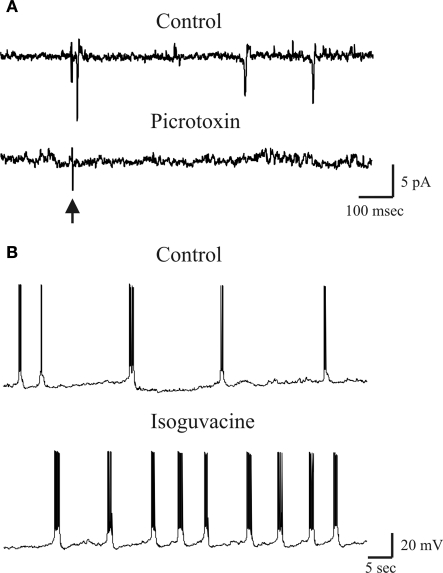
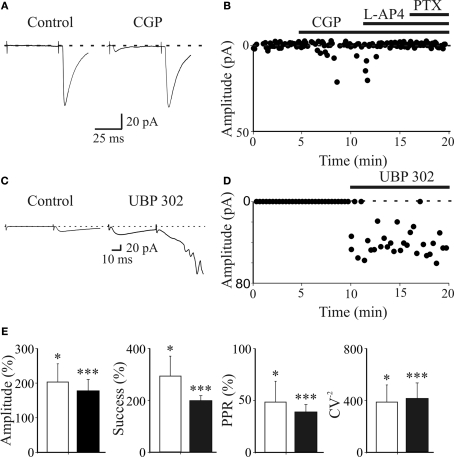
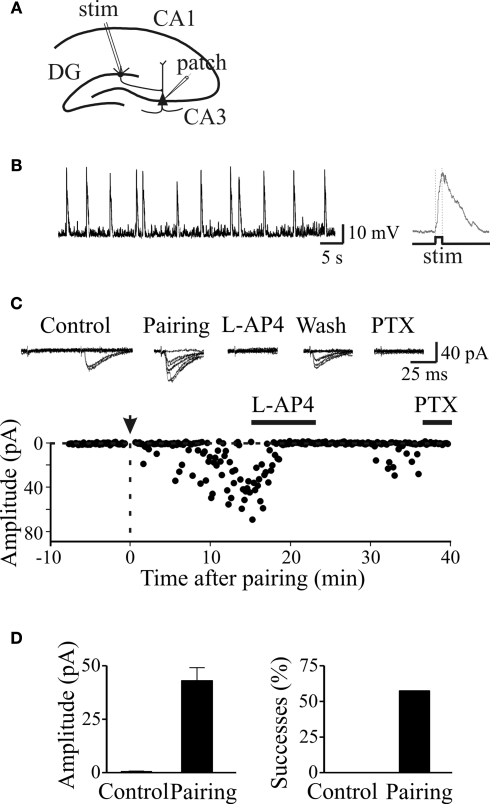
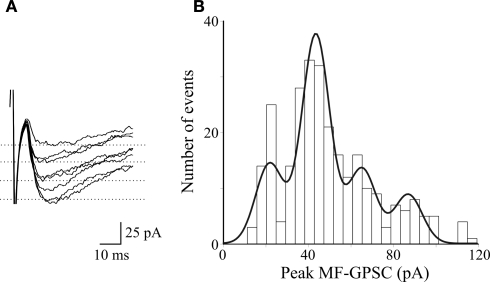
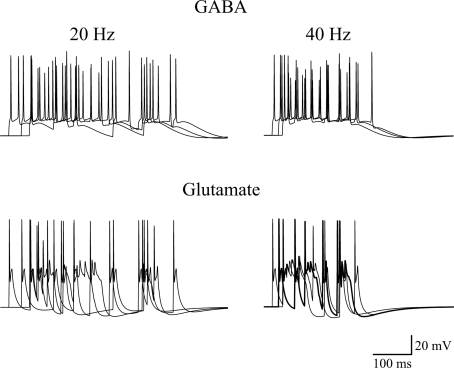
In this review some of the recent work carried out in our laboratory concerning the functional role of GABAergic signalling at immature mossy fibres (MF)-CA3 principal cell synapses has been highlighted. While in adulthood MF, the axons of dentate gyrus granule cells release onto CA3 principal cells and interneurons glutamate, early in postnatal life they release GABA, which exerts into targeted cells a depolarizing and excitatory action. We found that GABA(A)-mediated postsynaptic currents (MF-GPSCs) exhibited a very low probability of release, were sensitive to L-AP4, a group III metabotropic glutamate receptor agonist, and revealed short-term frequency-dependent facilitation. Moreover, MF-GPSCs were down regulated by presynaptic GABA(B) and kainate receptors, activated by spillover of GABA from MF terminals and by glutamate present in the extracellular medium, respectively. Activation of these receptors contributed to the low release probability and in some cases to synapses silencing. By pairing calcium transients, associated with network-driven giant depolarizing potentials or GDPs (a hallmark of developmental networks thought to represent a primordial form of synchrony between neurons), generated by the synergistic action of glutamate and GABA with MF activation increased the probability of GABA release and caused the conversion of silent synapses into conductive ones suggesting that GDPs act as coincident detector signals for enhancing synaptic efficacy. Finally, to compare the relative strength of CA3 pyramidal cell output in relation to their MF glutamatergic or GABAergic inputs in adulthood or in postnatal development, respectively, a realistic model was constructed taking into account different biophysical properties of these synapses.
Keywords: GABAA-mediated post synaptic currents; activity-dependent plasticity; developing hippocampus; mossy fibres; presynaptic GABAB receptors; presynaptic GluK1 receptors; quantal analysis; realistic modelling.
Figures
Similar articles
-
Role of giant depolarizing potentials in shaping synaptic currents in the developing hippocampus.Crit Rev Neurobiol. 2006;18(1-2):13-23. doi: 10.1615/critrevneurobiol.v18.i1-2.30. Crit Rev Neurobiol. 2006. PMID: 17725505 Review.
-
In the developing rat hippocampus, endogenous activation of presynaptic kainate receptors reduces GABA release from mossy fiber terminals.J Neurosci. 2010 Feb 3;30(5):1750-9. doi: 10.1523/JNEUROSCI.4566-09.2010. J Neurosci. 2010. PMID: 20130184 Free PMC article.
-
In the developing hippocampus kainate receptors control the release of GABA from mossy fiber terminals via a metabotropic type of action.Adv Exp Med Biol. 2011;717:11-26. doi: 10.1007/978-1-4419-9557-5_2. Adv Exp Med Biol. 2011. PMID: 21713663 Review.
-
At immature mossy fibers-CA3 connections, activation of presynaptic GABA(B) receptors by endogenously released GABA contributes to synapses silencing.Front Cell Neurosci. 2009 Feb 26;3:1. doi: 10.3389/neuro.03.001.2009. eCollection 2009. Front Cell Neurosci. 2009. PMID: 19277216 Free PMC article.
-
At immature mossy-fiber-CA3 synapses, correlated presynaptic and postsynaptic activity persistently enhances GABA release and network excitability via BDNF and cAMP-dependent PKA.J Neurosci. 2009 Feb 25;29(8):2637-47. doi: 10.1523/JNEUROSCI.5019-08.2009. J Neurosci. 2009. PMID: 19244539 Free PMC article.
Cited by
-
Mixed neurotransmission in the hippocampal mossy fibers.Front Cell Neurosci. 2013 Nov 22;7:210. doi: 10.3389/fncel.2013.00210. Front Cell Neurosci. 2013. PMID: 24319410 Free PMC article. Review.
-
Early Correlated Network Activity in the Hippocampus: Its Putative Role in Shaping Neuronal Circuits.Front Cell Neurosci. 2017 Aug 22;11:255. doi: 10.3389/fncel.2017.00255. eCollection 2017. Front Cell Neurosci. 2017. PMID: 28878628 Free PMC article. Review.
-
Neurotransmitter phenotype plasticity: an unexpected mechanism in the toolbox of network activity homeostasis.Dev Neurobiol. 2012 Jan;72(1):22-32. doi: 10.1002/dneu.20909. Dev Neurobiol. 2012. PMID: 21557513 Free PMC article. Review.
-
Deterministic and stochastic neuronal contributions to distinct synchronous CA3 network bursts.J Neurosci. 2012 Apr 4;32(14):4743-54. doi: 10.1523/JNEUROSCI.4277-11.2012. J Neurosci. 2012. PMID: 22492030 Free PMC article.
-
Neuronal calcium wave propagation varies with changes in endoplasmic reticulum parameters: a computer model.Neural Comput. 2015 Apr;27(4):898-924. doi: 10.1162/NECO_a_00712. Epub 2015 Mar 3. Neural Comput. 2015. PMID: 25734493 Free PMC article.
References
LinkOut - more resources
Full Text Sources
Molecular Biology Databases
Miscellaneous