. 2010 Sep 28:2:138.
doi: 10.3389/fnsyn.2010.00138. eCollection 2010.

Experience-dependent changes in excitatory and inhibitory receptor subunit expression in visual cortex

Affiliations

Experience-dependent changes in excitatory and inhibitory receptor subunit expression in visual cortex

Brett R Beston et al. Front Synaptic Neurosci. .

Abstract

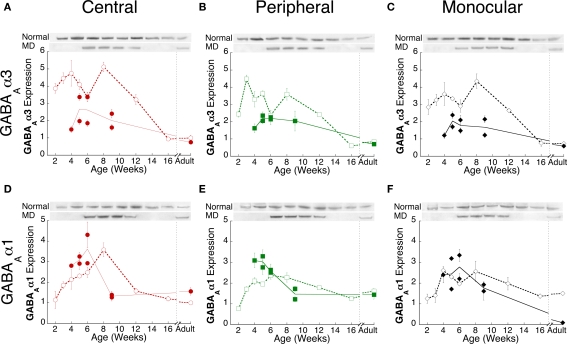
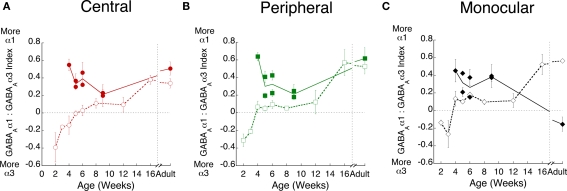
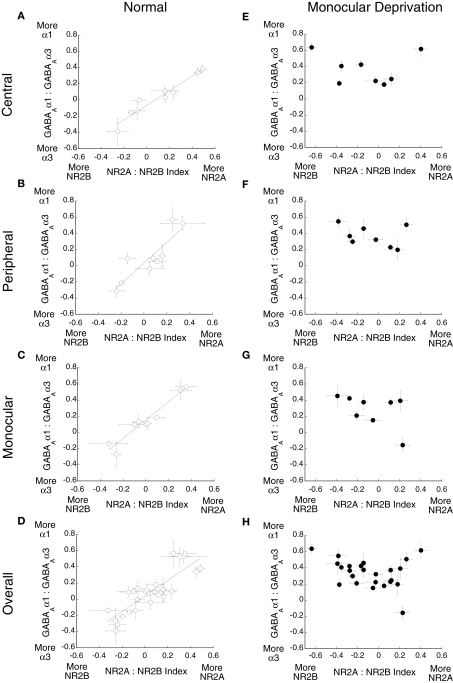
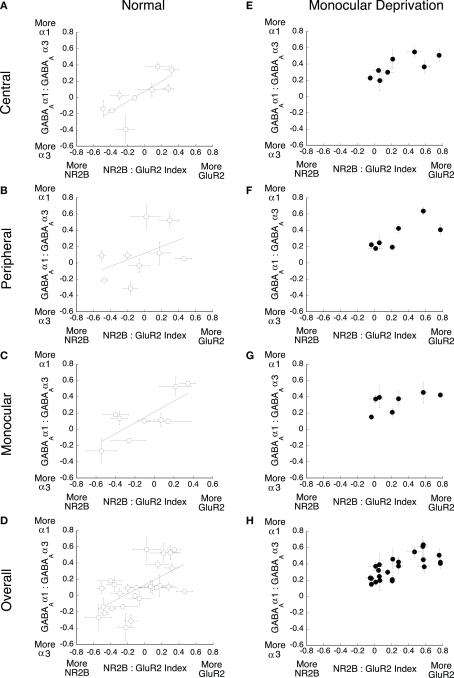
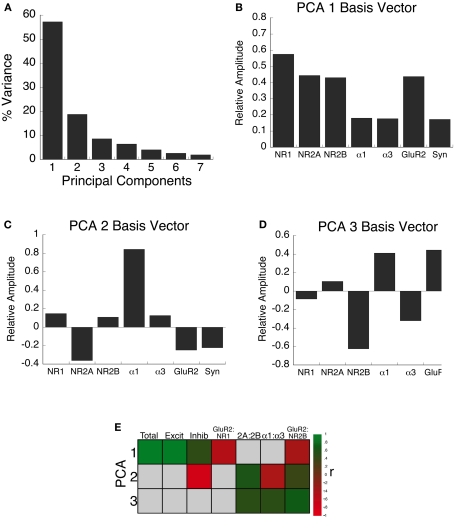
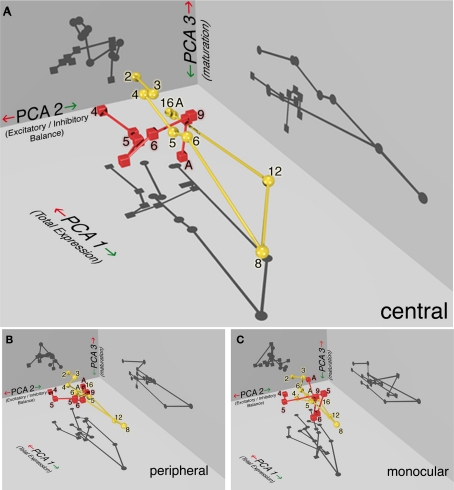
Experience-dependent development of visual cortex depends on the balance between excitatory and inhibitory activity. This activity is regulated by key excitatory (NMDA, AMPA) and inhibitory (GABA(A)) receptors. The composition of these receptors changes developmentally, affecting the excitatory-inhibitory (E/I) balance and synaptic plasticity. Until now, it has been unclear how abnormal visual experience affects this balance. To examine this question, we measured developmental changes in excitatory and inhibitory receptor subunits in visual cortex following normal visual experience and monocular deprivation. We used Western blot analysis to quantify expression of excitatory (NR1, NR2A, NR2B, GluR2) and inhibitory (GABA(A)α1, GABA(A)α3) receptor subunits. Monocular deprivation promoted a complex pattern of changes in receptor subunit expression that varied with age and was most severe in the region of visual cortex representing the central visual field. To characterize the multidimensional pattern of experience-dependent change in these synaptic mechanisms, we applied a neuroinformatics approach using principal component analysis. We found that monocular deprivation (i) causes a large portion of the normal developmental trajectory to be bypassed, (ii) shifts the E/I balance in favor of more inhibition, and (iii) accelerates the maturation of receptor subunits. Taken together, these results show that monocularly deprived animals have an abnormal balance of the synaptic machinery needed for functional maturation of cortical circuits and for developmental plasticity. This raises the possibility that interventions intended to treat amblyopia may need to address multiple synaptic mechanisms to produce optimal recovery.

Keywords: AMPA; GABAA; NMDA; amblyopia; development; excitatory–inhibitory balance; monocular deprivation; plasticity.


Figures

Figure 1
Figure 1
Tissue sample collection across visual cortex and corresponding visual field representation. The expression of synaptic proteins was quantified from tissue samples collected in the central (c), peripheral (p), and monocular (m) visual field representations of primary visual cortex (Ai-Aii). The location of visual field representation in primary visual cortex was assessed using anatomical markers previously identified by Tusa et al. (1978) (B).
Figure 2
Figure 2
Experience-dependent changes in NMDA and AMPA receptor subunit expression Comparison of excitatory receptor subunits NR1 (A–C), NR2A (D–F), NR2B (G–I) and GluR2 (J–L) in normal (open symbols, dashed lines) and monocularly deprived (filled symbols, solid lines) kittens from the central (red circles), peripheral (green squares) and monocular (black diamonds) visual field representations during postnatal development. For each subunit, the plots were normalized relative to the average normal adult expression in the central visual field. Error bars indicate the s.e.m. Representative Western blot bands are shown above each plot.
Figure 3
Figure 3
Regional changes in the expression of excitatory receptor subunits (A) NR1, (B) NR2A, (C) NR2B, and (D) GluR2 in kittens monocularly deprived up to 6 weeks of age. The expression in the central (red), peripheral (green), and monocular (black) visual field representation was measured as a percent of age matched normal kittens for each region of visual cortex. Dashed lines represent the relative expression in normally reared kittens. Significant differences are indicated (*p < 0.05;**p < 0.01).
Figure 4
Figure 4
Monocular deprivation shifts the maturation of receptor subunit composition. Experience-dependent maturation of the (A–C) NR2A:NR2B, (D–F) NR1:GluR2, and (G–I) NR2B:GluR2 indices was quantified for normal (open symbols, dashed lines) and monocularly deprived (filled symbols, solid lines) kittens. Monocular deprivation affected each of the indices. It delayed the shift to NR2A, but accelerated the shift to GluR2.
Figure 5
Figure 5
Experience-dependent changes in GABAA receptor subunit expression. Comparison of GABAAα3 (A–C) and GABAAα1 (D–F) subunit expression in normal (open symbols, dashed lines) and monocularly deprived (filled symbols, solid lines) kittens from the central (red circles), peripheral (green squares) and monocular (black diamonds) visual field representations during postnatal development. For each subunit, the plots were normalized relative to the average normal adult expression in the central visual field. Error bars indicate the s.e.m. Representative Western blot bands are shown above each plot.
Figure 6
Figure 6
Monocular deprivation accelerates the switch to GABAAα1. Experience-dependent maturation of the GABAAα1:GABAAα3 index was quantified in normal (open symbols, dashed lines) and monocularly deprived (filled symbols, solid lines) kittens in the (A) central (red circles), (B) peripheral (green squares), and (C) monocular (black diamonds) visual field representations.
Figure 7
Figure 7
Monocular deprivation disrupts the balance between NR2A:NR2B and GABAAα1:GABAAα3. The relationship between these indices was plotted for (A–D) normal and (E–H) monocularly deprived animals. Significant correlations were found for normal animals (A) central (r = 0.96, p < 0.01), (B) peripheral (r = 0.88, p < 0.01) (C) monocular (r = 0.79, p < 0.01), and (D) overall (r = 0.78, p < 0.01), but no significant correlations were found for deprived animals.
Figure 8
Figure 8
Monocular deprivation disrupts the balance between NR2B:GluR2 and GABAAα1:GABAAα3. The relationship between these indices was plotted for (A–D) normal and (E–H) monocularly deprived animals. Significant correlations were found for normal animals (A) central (r = 0.75 p < 0.025), (B) peripheral (r = 0.65 p < 0.05) (C) monocular (r = 0.77 p < 0.01), and (D) overall (r = 0.62 p < 0.01), but no significant correlations were found for deprived animals.
Figure 9
Figure 9
Principal component analysis. (A) The percent of variance captured by each component from SVD analysis of receptor subunit expression in visual cortex of normal and monocularly deprived kittens. The first three principal components represent the significant portion (85%) of the SVD. (B–D) The influence of each subunit on the three principal components was reflected by the relative amplitudes in the basis vectors. (E) Significant correlations (colored cells) between the three principal components and the combinations of receptor subunit expression derived from the basis vectors (see Results). The color indicates the magnitude (represented by color intensity) and direction (green indicates positive, red indicates negative) of significant correlations (Bonferroni corrected, p < 0.007).
Figure 10
Figure 10
Monocularly deprived animals show a distinct developmental trajectory for receptor subunit expression. The PCA results are plotted in 3-dimensions to visualize the significant components for normal (yellow spheres) and monocularly deprived (red cubes) kittens in the (A) central, (B) peripheral, and (C) monocular visual field representation of visual cortex. The shadows projected on each of the three walls help to visualize the differences between normal (circles) and deprived (squares) kittens for each of the three components. Age (in weeks) is displayed beside each symbol and the connecting lines link the points by age. PCA 1 captures experience-dependent changes in total receptor subunit expression, PCA 2 captures changes in the E/I balance and PCA 3 captures the maturation of receptor composition. The developmental trajectory for normal animals (yellow sphere, circle shadows) can be described as a slowly descending curved staircase that traversed a long direction of increasing expression (PCA 1) and slow maturation of receptor subunits (PCA 3) between 2 and 8 weeks of age followed by turning a corner to a new E/I balance (PCA 2) at 12 weeks and pruning back the total receptor expression by 16 weeks. The trajectory for deprived kittens (red cubes, square shadows) was shifted on all three dimensions and truncated from the normal pattern. The difference between normal and deprived kittens was greatest for the (A) central visual field and less for the (B) peripheral and (C) monocular regions.

Similar articles

Cited by

References

    1. Antonini A., Stryker M. P. (1993). Rapid remodeling of axonal arbors in the visual cortex. Science 260, 1819–182110.1126/science.8511592 - DOI - PubMed
    1. Araujo F., Tan S., Ruano D., Schoemaker H., Benavides J., Vitorica J. (1996). Molecular and pharmacological characterization of native cortical gamma-aminobutyric acidA receptors containing both alpha1 and alpha3 subunits. J. Biol. Chem. 271, 27902–2791110.1074/jbc.271.44.27902 - DOI - PubMed
    1. Bear M. F., Kleinschmidt A., Gu Q. A., Singer W. (1990). Disruption of experience-dependent synaptic modifications in striate cortex by infusion of an NMDA receptor antagonist. J. Neurosci. 10, 909–925 - PMC - PubMed
    1. Blakemore C., Van Sluyters R. C. (1974). Reversal of the physiological effects of monocular deprivation in kittens: further evidence for a sensitive period. J. Physiol. 237, 195–216 - PMC - PubMed
    1. Bonnert T. P., McKernan R. M., Farrar S., le Bourdelles B., Heavens R. P., Smith D. W., Hewson L., Rigby M. R., Sirinathsinghji D. J., Brown N., Wafford K. A., Whiting P. J. (1999). Theta, a novel gamma-aminobutyric acid type A receptor subunit. Proc. Natl. Acad. Sci. U.S.A. 96, 9891–989610.1073/pnas.96.17.9891 - DOI - PMC - PubMed

LinkOut - more resources