. 2011 Mar 15;6(3):e17881.
doi: 10.1371/journal.pone.0017881.

Design of glycopeptides used to investigate class II MHC binding and T-cell responses associated with autoimmune arthritis

Affiliations

Design of glycopeptides used to investigate class II MHC binding and T-cell responses associated with autoimmune arthritis

Ida E Andersson et al. PLoS One. .

Abstract

The glycopeptide fragment CII259-273 from type II collagen (CII) binds to the murine A(q) and human DR4 class II Major Histocompatibility Complex (MHC II) proteins, which are associated with development of murine collagen-induced arthritis (CIA) and rheumatoid arthritis (RA), respectively. It has been shown that CII259-273 can be used in therapeutic vaccination of CIA. This glycopeptide also elicits responses from T-cells obtained from RA patients, which indicates that it has an important role in RA as well. We now present a methodology for studies of (glyco)peptide-receptor interactions based on a combination of structure-based virtual screening, ligand-based statistical molecular design and biological evaluations. This methodology included the design of a CII259-273 glycopeptide library in which two anchor positions crucial for binding in pockets of A(q) and DR4 were varied. Synthesis and biological evaluation of the designed glycopeptides provided novel structure-activity relationship (SAR) understanding of binding to A(q) and DR4. Glycopeptides that retained high affinities for these MHC II proteins and induced strong responses in panels of T-cell hybridomas were also identified. An analysis of all the responses revealed groups of glycopeptides with different response patterns that are of high interest for vaccination studies in CIA. Moreover, the SAR understanding obtained in this study provides a platform for the design of second-generation glycopeptides with tuned MHC affinities and T-cell responses.


Conflict of interest statement

Competing Interests: JK is partly employed by AstraZeneca R&D Mölndal. At this position JK is not working within the area of autoimmune arthritis. The authors confirm that the JK connection with AstraZeneca R&D Mölndal does not alter their adherence to all the PLoS ONE policies on sharing data and materials.

Figures

Figure 1
Figure 1. Glycopeptide CII259–273 (1).
1 activates autoimmune T-cells when presented by the MHC II Aq protein.
Figure 2
Figure 2. Structural models of the complexes between CII259–270 and Aq or DR4.
Glycopeptide CII259–270 is bound to the proteins in the characteristic extended conformation with the galactose moiety pointing out from the protein. a) Comparative model of CII259–270/Aq , . The side chains of Ile260 (in p260) and Phe263 (in p263) are anchored in the P1 and P4 pockets. P1 is a well-defined, lipophilic pocket of medium size while P4 is a relatively deep, mainly lipophilic pocket. b) Structural model of the complex between CII259–270 and a crystal structure of the DR4 protein. The side chain of Phe263 (in p263) is anchored in the DR4 P1 pocket, which is a large, deep and mainly lipophilic pocket. Consequently, Ile260 (in p260) is found in the P-3 position on the flanking region of the DR4 binding site.
Figure 3
Figure 3. PCA loading and score plots of amino acids score values.
a) Loading plot of mean scoring values, standard deviations, top scoring values and frequency of appearance of amino acids present in the docked peptides. b) Score plot of amino acids and their separation due to differences in scoring results. Colored markings indicate selected amino acids. Green dots and blue crosses correspond to amino acids in p260 and p263, respectively, while the red dot and cross correspond to the original amino acids in p260 and p263, respectively.
Figure 4
Figure 4. Score plots from PCA models based on amino acid physicochemical properties.
Principal properties that dominate each PC are indicated by the axes. Red dots indicate selected amino acids. Green dots and blue crosses indicate unselected amino acids. a) PC1 vs. PC2 for the p260 amino acids. b) PC2 vs. PC3 for the p260 amino acids. c) PC1 vs. PC2 for the p263 amino acids. d) PC2 vs. PC3 for the p263 amino acids.
Figure 5
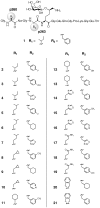
Figure 5. Anchor-modified CII259–273 glycopeptides.
Glycopeptides 221 with modified residues at positions p260 and p263 were synthesized using solid-phase glycopeptide synthesis.
Figure 6
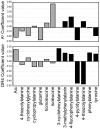
Figure 6. PLS regression coefficient plots.
The PLS models were created by relating glycopeptide properties (expressed via the presence of a specific amino acid) and their binding capacity to Aq (upper plot) and DR4 (lower plot) at peptide concentrations of 100 µM and 500 µM, respectively. A large positive coefficient indicates that the amino acid was beneficial for a high affinity. Grey bars represent p260 while black bars represent p263. The indane derivative (2-aminoindane-2-carboxylic acid) is abbreviated to Aic.
Figure 7
Figure 7. Response pattern displayed by the glycopeptides.
The response pattern is visualized by score and loading plot from PCA based on the results from the Aq and DR4 binding and T-cell recognition assays. a) 3D score plot of PC1, PC2 and PC3 displaying similarities and differences between glycopeptides depending on response patterns. Circles indicate groups among the glycopeptides discussed in the text. b) Loading plot of the biological responses. Aq and DR4 binding at 100 µM and 500 µM are indicated by red and green spheres, respectively. Aq-restricted hybridomas 22a1-7E, HCQ.3, HCQ.10, HD13.9, HM1R.2 and HNC.1 and DR4-restricted hybridomas mDR17.2 and hDR11.2 at concentrations 150, 30 and 6 µM are indicated by yellow and blue spheres, respectively. Hybridomas specifically discussed in the text are indicated by their names.

References

    1. Gregersen PK, Silver J, Winchester RJ. The Shared Epitope Hypothesis. An Approach to Understanding the Molecular Genetics of Susceptibility to Rheumatoid Arthritis. Arthritis Rheum. 1987;30:1205–1213. - PubMed
    1. Courtenay JS, Dallman MJ, Dayan AD, Martin A, Mosedale B. Immunisation Against Heterologous Type II Collagen Induces Arthritis in Mice. Nature. 1980;283:666–668. - PubMed
    1. Wooley PH, Luthra HS, Stuart JM, David CS. Type II Collagen-Induced Arthritis in Mice. I. Major Histocompatibility Complex (I Region) Linkage and Antibody Correlates. J Exp Med. 1981;154:688–700. - PMC - PubMed
    1. Brunsberg U, Gustafsson K, Jansson L, Michaëlsson E, Ährlund-Richter L, et al. Expression of a Transgenic Class II Ab Gene Confers Susceptibility to Collagen-Induced Arthritis. Eur J Immunol. 1994;24:1698–1702. - PubMed
    1. Bäcklund J, Treschow A, Bockermann R, Holm B, Holm L, et al. Glycosylation of Type II Collagen is of Major Importance for T Cell Tolerance and Pathology in Collagen-Induced Arthritis. Eur J Immunol. 2002;32:3776–3784. - PubMed

Publication types

MeSH terms