. 2011 Mar;7(3):e1001327.
doi: 10.1371/journal.pgen.1001327. Epub 2011 Mar 10.

Global analysis of the relationship between JIL-1 kinase and transcription

Affiliations

Global analysis of the relationship between JIL-1 kinase and transcription

Catherine Regnard et al. PLoS Genet. 2011 Mar.

Abstract

The ubiquitous tandem kinase JIL-1 is essential for Drosophila development. Its role in defining decondensed domains of larval polytene chromosomes is well established, but its involvement in transcription regulation has remained controversial. For a first comprehensive molecular characterisation of JIL-1, we generated a high-resolution, chromosome-wide interaction profile of the kinase in Drosophila cells and determined its role in transcription. JIL-1 binds active genes along their entire length. The presence of the kinase is not proportional to average transcription levels or polymerase density. Comparison of JIL-1 association with elongating RNA polymerase and a variety of histone modifications suggests two distinct targeting principles. A basal level of JIL-1 binding can be defined that correlates best with the methylation of histone H3 at lysine 36, a mark that is placed co-transcriptionally. The additional acetylation of H4K16 defines a second state characterised by approximately twofold elevated JIL-1 levels, which is particularly prominent on the dosage-compensated male X chromosome. Phosphorylation of the histone H3 N-terminus by JIL-1 in vitro is compatible with other tail modifications. In vivo, phosphorylation of H3 at serine 10, together with acetylation at lysine 14, creates a composite histone mark that is enriched at JIL-1 binding regions. Its depletion by RNA interference leads to a modest, but significant, decrease of transcription from the male X chromosome. Collectively, the results suggest that JIL-1 participates in a complex histone modification network that characterises active, decondensed chromatin. We hypothesise that one specific role of JIL-1 may be to reinforce, rather than to establish, the status of active chromatin through the phosphorylation of histone H3 at serine 10.


Conflict of interest statement

The authors have declared that no competing interests exist.

Figures
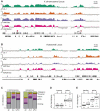
Figure 1
Figure 1. JIL-1 is a mark for gene activity and for dosage compensation in SL2 cells.
High resolution ChIP on chip profiles of JIL-1, ePol, H4K16ac and H3K36me3 . The data is represented as average log2 signal ratio of IP over input. Bars are coloured when the signal is above zero. The dark grey line toping each profile represents the mean signal within a 500 bp window centred on the probe. High affinity sites (HAS) for the DCC according to are depicted as red boxes above the gene annotations. A representative 250 kb portion has been selected (A) for the X chromosome and (B) for chromosome 3R. (C) Fractional distribution of oligonucleotides according to genomic features is shown for all probes on the array (n = 384680) and compared to the ones within JIL-1 (n = 112954) and ePol (n = 125303) binding regions as determined by hidden markov modelling. (D) The density per gene was defined as the average ratio (IP/input) of probes within a gene. The densities of ePol on autosomal genes (labelled A) and X-linked genes (labelled X) in a box plot representation. Activity status was determined by microarray expression profiling. (E) JIL-1 densities on the same sets of genes as in D, the median values for active autosomal and X-linked genes are given. The boxplot representation in all figures define 25th to 75th percentiles (boxes), 50th percentile (lines in boxes), and ranges (whiskers, 1.5 times the interquartile range extended from both ends of the box). Outliers were removed from the analysis.
Figure 2
Figure 2. JIL-1 is enriched at the 3′ end of phl and is twofold enriched at X-linked loci in male flies.
Comparison of the distribution of JIL-1, ePol, H4K16ac and H3K36me3 on the X-linked gene phl in SL2 cells. (A) Signals as revealed by ChIP-chip profiling were compared to (B) the qPCR-based quantification of unamplified material. The position of the amplicons used for qPCR is indicated above the gene annotations. The relative enrichments from amplicons A to D were calculated using the intergenic region located ∼2 kb left of the gene ptr (ptr_IG) as a reference. (C) Comparison of the enrichment of JIL-1, H3K36me3 and H4K16ac at the 3′ end of the active X-linked genes phl, CG14804, sta, Pgd, RpII215 and of the active autosomal gene Cortactin. The inactive X-linked gene runt, the promoter region of the annexin IX gene flanking the Cortactin gene and the intergenic region close to ptr served as negative control regions. Signals were normalized to the annexin IX locus and error bars represent the standard error of the mean for 3 independent biological replicates.
Figure 3
Figure 3. JIL-1–dependent H3S10phK14ac is enriched on the compensated X chromosome together with JIL-1.
(A) Genome-wide distribution of H3S10phK14ac in comparison to JIL-1 and H4K16ac on a 140 kb X-chromosomal locus close to the gene phl. (B) Fractional distribution of probes significantly enriched for H3S10phK14ac (n = 4478) with respect to chromosomal location. As a comparison, the distribution of all probes (n = 384680) represented on the array is shown. (C) Cumulative binding profiles of H3S10phK14ac along genes that are either bound (n = 3362) or not bound (n = 2050) by JIL-1. (D) Decrease of H3S10phK14ac ChIP signal at the 3′ end of the genes phl, CG12467, Suv4.20, CG14804 and RpII215 after JIL-1 RNAi as compared to a control GST RNAi. The intergenic region close to ptr and the inactive gene Fz3 are shown as negative control regions. Results are the mean of 3 biological replicates and error bars represent the standard error of the mean. In the insert, we showed that the difference of the H3S10phK14ac ChIP signal after JIL-1 depletion is 4 times higher for target loci compared to control loci after normalization. This difference is statistically significant since the 2-sided unpaired t-test applied to the data gave a p value <0.05.
Figure 4
Figure 4. Effects of JIL-1 RNAi on gene expression and H4K16ac localization in SL2 cells.
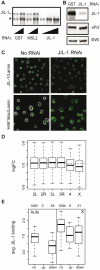
(A) The knock-down of JIL-1 was assessed by western blotting on whole cell extracts after 7 days of RNA interference (RNAi). RNAi against GST and MSL2 were used as controls. The affinity-purified serum of R69 was used to detect JIL-1. A cross-reacting protein of smaller size (*) was not affected. Two and three serial dilutions of the extract were loaded for controls and JIL-1 RNAi samples, respectively. (B) Levels of ePol detected with the H5 antibody were unaffected upon JIL-1 RNAi. The ATPase ISWI served as a loading control. (C) SL2 cells were immunostained for JIL-1, H4K16ac (in green) and lamin (in white) and analyzed by confocal imaging. (D) Log2 fold changes in gene expression after JIL-1 RNAi as compared to GST or GFP RNAi (ctr RNAi) summarized by chromosomes in a box plot. The dashed horizontal line indicates the median change of all active genes. (E) The average binding of JIL-1 per gene was plotted for autosomal genes on the left (Auto) and X-linked genes on the right (X) distinguishing genes with no expression change over JIL-1 depletion (‘no’), up-regulated genes (‘up’) and down-regulated genes (‘down’). The numbers on top indicate the number of genes in each category.
Figure 5
Figure 5. JIL-1 distributes differently than elongating polymerase on active chromatin.
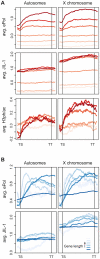
Average distribution profiles of chromatin features along genes scaled for length from transcription start (TS) to termination sites (TT). (A) All genes covered by the tiling array were grouped into 6 equally-sized bins based on increasing densities of ePol. Average profiles of ePol (top), JIL-1 (centre) and H3S10phK14ac (bottom) were calculated for each group. The increasing darkness of the red lines indicate an increasing density of ePol on the genes between the groups. (B) Genes were binned based on their length. The length distribution within the bins is the following: 287-1204, 1204-1780, 1780-2477, 2477-3778, 3778-7400 and 7400-162904 bp. Average profiles on the grouped genes are displayed for ePol (top) and JIL-1 (bottom).
Figure 6
Figure 6. JIL-1 distribution upon activation of a reporter construct in flies.
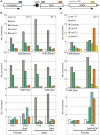
(A) The reporter construct encompassing five UAS in front of a LacZ reporter carries a miniwhite gene . It is inserted on 3R at position 93B8 with the UAS close to the 3′ end of the Cortactin gene. The cartoon is drawn to scale, except for the negligible size of the UAS in order to visualize the distances between the amplicons (coloured boxes) used for qPCR analysis in panels B and C. (B) Activation of the LacZ reporter was achieved by crossing the homozygote reporter line to the Tubulin-Gal4/TM3 driver line expressing Gal4fl under control of the tubulin promoter. Relative β-galactosidase activity as measured in the corresponding flies is provided on the bottom of the panels. The reference was set to 0.5× for the heterozygote reporter line in the absence of activation. The ChIP signals for JIL-1 (upper panel), H3K36me3 (centre panel) and H4K16a (lower panel) at the intergenic locus (ptr_IG), at the 3′ of active X-linked gene (phl-D), at the 3′ of the Cortactin gene and at the 5′ and 3′ of the LacZ reporter gene are displayed. The data is provided as relative enrichments over the intergenic locus (ptr_IG). (C) For activation of the reporter by Gal4-MOF, the homozygote reporter line was used as a reference and compared to the stable line carrying both the homozygote reporter construct and the homozygote transgene leading to Gal4-MOF expression . Only females were analyzed. The activity measurements for the two different types of females are mentioned below the graphs and can be compared to the values in B. In addition to the amplicons used in (B) we also analyzed binding to the 3′ end of the miniwhite gene. Because of the inherent variability of chromatin preparation one representative biological replicate is presented here.
Figure 7
Figure 7. Distribution of JIL-1 on the X-chromosome.
(A) Localization of JIL-1 (left panels, green in the merged pictures) in SXB1-2C and 2xNOPU females expressing increasing amounts of MSL2 (coloured red in the merged pictures on the right). (B) Densities of various features on active X-chromosomal genes grouped by increasing distance from high affinity sites (HAS) for the DCC. There are 115, 121, 405 and 465 genes in the group of genes located at increasing distances from HAS, respectively.
Figure 8
Figure 8. Correlations of H3K36me3, H4K16ac, and JIL-1 binding.
Pair-wise correlations of JIL-1 versus ePol, H3K36me3, H4K16ac and the sum of H3K36me3 and H4K16ac signals in unified 200 bp sampling windows. (A) Results for the X chromosome (B) for autosomes (C) and for the entire genome. Pearson correlation coefficients are provided for each panel.

Similar articles

Cited by

References

    1. Wang Y, Zhang W, Jin Y, Johansen J, Johansen KM. The JIL-1 tandem kinase mediates histone H3 phosphorylation and is required for maintenance of chromatin structure in Drosophila. Cell. 2001;105:433–443. - PubMed
    1. Jin Y, Wang Y, Walker DL, Dong H, Conley C, et al. JIL-1: a novel chromosomal tandem kinase implicated in transcriptional regulation in Drosophila. Mol Cell. 1999;4:129–135. - PubMed
    1. Bao X, Cai W, Deng H, Zhang W, Krencik R, et al. The COOH-terminal domain of the JIL-1 histone H3S10 kinase interacts with histone H3 and is required for correct targeting to chromatin. J Biol Chem. 2008;283:32741–32750. - PMC - PubMed
    1. Deng H, Zhang W, Bao X, Martin JN, Girton J, et al. The JIL-1 kinase regulates the structure of Drosophila polytene chromosomes. Chromosoma. 2005;114:173–182. - PubMed
    1. Deng H, Bao X, Cai W, Blacketer MJ, Belmont AS, et al. Ectopic histone H3S10 phosphorylation causes chromatin structure remodeling in Drosophila. Development. 2008;135:699–705. - PubMed

Publication types

MeSH terms

Associated data