

Accurate and fast simulation of channel noise in conductance-based model neurons by diffusion approximation
- PMID: 21423712
- PMCID: PMC3053314
- DOI: 10.1371/journal.pcbi.1001102
Accurate and fast simulation of channel noise in conductance-based model neurons by diffusion approximation
Abstract
Stochastic channel gating is the major source of intrinsic neuronal noise whose functional consequences at the microcircuit- and network-levels have been only partly explored. A systematic study of this channel noise in large ensembles of biophysically detailed model neurons calls for the availability of fast numerical methods. In fact, exact techniques employ the microscopic simulation of the random opening and closing of individual ion channels, usually based on Markov models, whose computational loads are prohibitive for next generation massive computer models of the brain. In this work, we operatively define a procedure for translating any Markov model describing voltage- or ligand-gated membrane ion-conductances into an effective stochastic version, whose computer simulation is efficient, without compromising accuracy. Our approximation is based on an improved Langevin-like approach, which employs stochastic differential equations and no Montecarlo methods. As opposed to an earlier proposal recently debated in the literature, our approximation reproduces accurately the statistical properties of the exact microscopic simulations, under a variety of conditions, from spontaneous to evoked response features. In addition, our method is not restricted to the Hodgkin-Huxley sodium and potassium currents and is general for a variety of voltage- and ligand-gated ion currents. As a by-product, the analysis of the properties emerging in exact Markov schemes by standard probability calculus enables us for the first time to analytically identify the sources of inaccuracy of the previous proposal, while providing solid ground for its modification and improvement we present here.
Conflict of interest statement
The authors have declared that no competing interests exist.
Figures
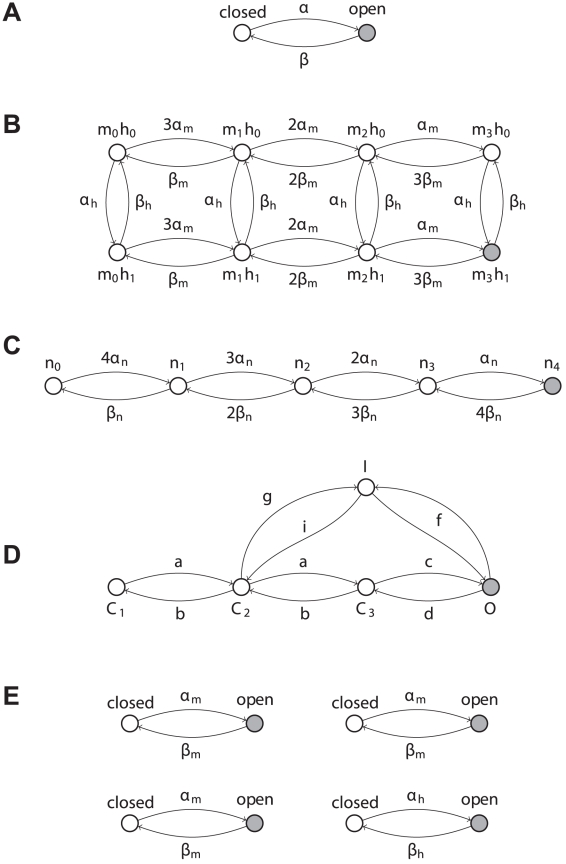
 and
and  are rates, as they represent the transition probabilities between states, expressed per time unit. In a more general case, single-channel kinetics is described by an
  -state scheme. Voltage-gated fast-inactivating sodium (B) and delayed-rectifier potassium channels (C) are two examples, where only one state corresponds to a non-zero channel conductance (filled grey circle). An alternative model for sodium channels (D) (Vandenberg and Bezanilla, 1991) is also shown for comparison. We point out that our method can be applied to any kind of kinetic schemes, where the transition rates are known. For (B–C), each state is identified by an arbitrary name convention (
 ,
,  ,
,  , etc.), referring to the underlying mapping of these 8- and 5-state channels into multiple 2-state gated subunits (panel E). Indeed, some
  -state kinetic schemes may be mapped into, or experimentally identified as, a set of independent 2-state gates: the open state of the full scheme corresponds to all the elementary gates in the open states, simultaneously. For instance, the kinetic scheme (B) could be mapped into a set of four independent 2-state gates (E) (i.e., the familiar activation gates and the inactivation gate of sodium fast-inactivating currents), three of whom are identical.
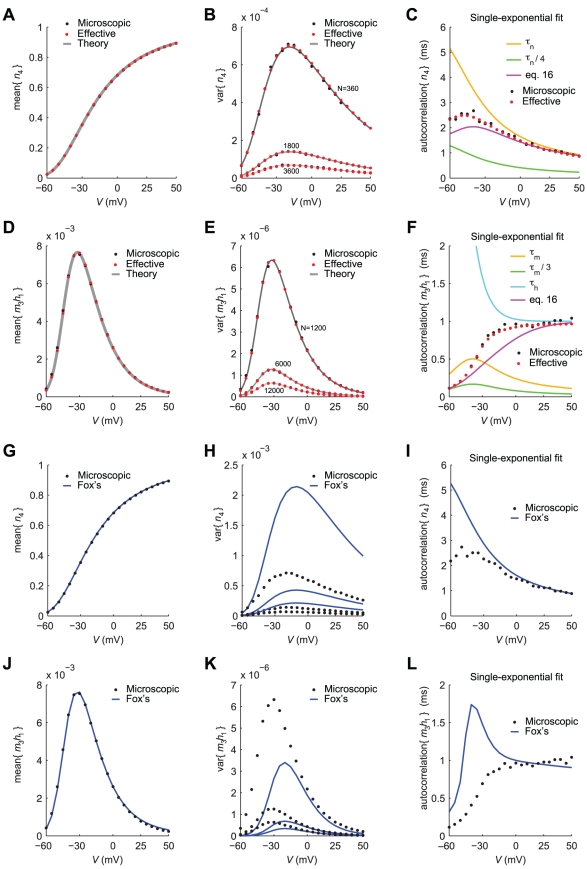
 is studied for the mean of
  (A,D) and for its variance (B,E). For an increasing number
  of channels, the variance decreases, as expected. Panels C,F show the time constant of the best-fit single-exponential, which approximates the covariance of
  (see Eq. 17). The mismatch between actual best-fit values and the characteristic subunit gating time-constants (
 ,
,  ,
,  , shown for comparison), clearly indicates that great care should be taken in deriving accurate Langevin-kind formulations. Panels G–L repeat the very same comparisons presented in panels A–F, for the Langevin-approximation introduced by Fox and coworkers (Fox, 1997; Fox and Lu, 1994): the variance of potassium currents is overestimated (H), whereas the variance of sodium currents is underestimated (K). In addition, the autocorrelation properties are not reproduced correctly (I,L).
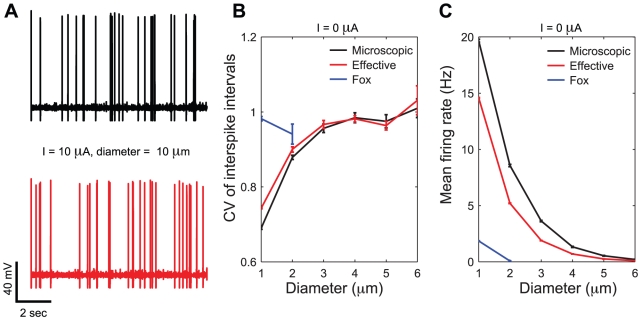
 ) are applied to both the microscopic (black sample trace) and the effective models (red sample trace), the increase in channel noise variances (see Fig. 2C,F) induces a highly irregular spontaneous emission of action potentials, with qualitatively very similar properties. In these simulations, both length and diameter of the neuron are set to
  , and the single channel conductance for both sodium and potassium channels is
  . Panels B,C show respectively the CV of the ISI distribution and the mean firing rate as a function of cell diameter: results are reported for the microscopic, effective and Fox's models (black, red and blue traces, respectively). The results of panels B,C refer to spontaneous activity (i.e., no injected current) with neuron length held fixed at the value
  .
.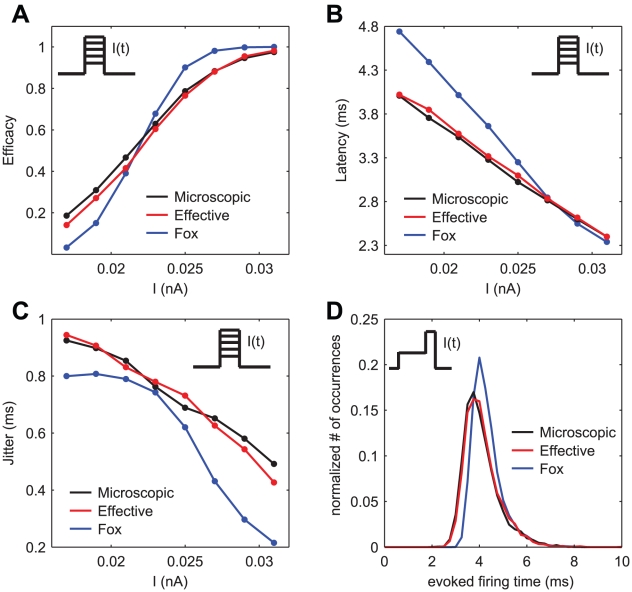
 repeated for 10000 trials. Black and red traces and dots result from the simulations of the exact kinetic schemes and from our diffusion approximation, and in blue we indicate the results from the simulation of the Langevin-approximation introduced by Fox. Panel D shows the distribution of spike occurrence times, evoked by a biphasic stimulus over 10000 trials: the duration and amplitude of the preconditioning part are
  and
and  , respectively, the duration and amplitude of the second part are
  and
and  . In all panels, the neuron is simulated as a single cylindrical compartment of length and diameter equal to
  and single channel conductances equal to
  , for both sodium and potassium channels. The integration time step was set to
  .
.
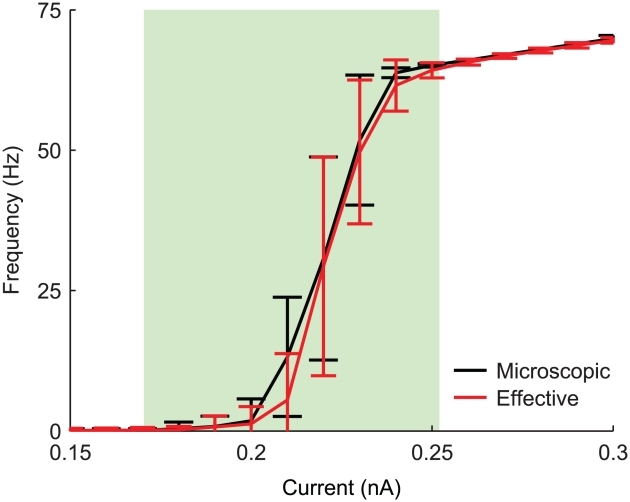
 ) and precision (
 ) are in accordance with those measured in in vitro experiments. In particular, in panel A:
  ,
,  for the microscopic model,
  ,
,  for the effective model. Panel B:
  ,
,  for the microscopic model,
  ,
,  for the effective model. The DC pulse has an amplitude of
  , whereas the noisy stimulus is the same realisation of an Ornstein-Uhlenbeck's process, with mean and standard deviation set to
  , and with autocorrelation time length set to
  .
.
 .
.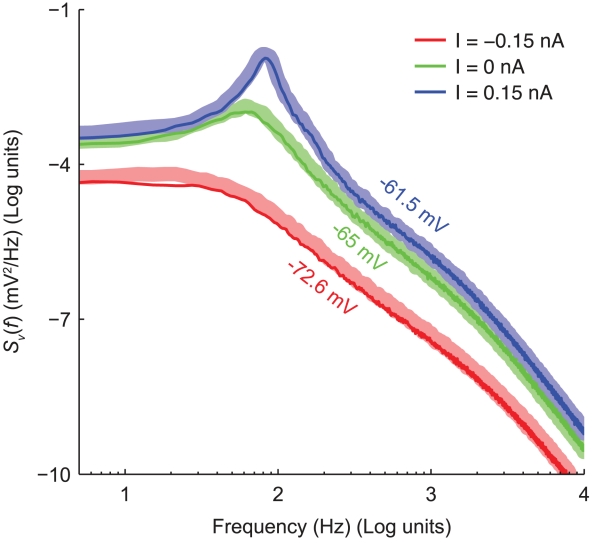
 of simulated recordings of the membrane potential were obtained under weak holding currents ({
 ), resulting in membrane potential traces fluctuating around an offset ({
 ). Rare spontaneous spikes were removed from the analysis, excluding the
  preceding and the
  following each spike. The spectra have been obtained by applying the Welch method, on moving windows of duration
  and overlapping by
  , and subsequently averaging the results.
Similar articles
-
Comparison of Langevin and Markov channel noise models for neuronal signal generation.Phys Rev E Stat Nonlin Soft Matter Phys. 2010 Jan;81(1 Pt 1):011918. doi: 10.1103/PhysRevE.81.011918. Epub 2010 Jan 29. Phys Rev E Stat Nonlin Soft Matter Phys. 2010. PMID: 20365410
-
Stochastic differential equation models for ion channel noise in Hodgkin-Huxley neurons.Phys Rev E Stat Nonlin Soft Matter Phys. 2011 Apr;83(4 Pt 1):041908. doi: 10.1103/PhysRevE.83.041908. Epub 2011 Apr 11. Phys Rev E Stat Nonlin Soft Matter Phys. 2011. PMID: 21599202 Free PMC article.
-
Evaluation of stochastic differential equation approximation of ion channel gating models.Ann Biomed Eng. 2009 Apr;37(4):824-38. doi: 10.1007/s10439-009-9635-z. Epub 2009 Jan 17. Ann Biomed Eng. 2009. PMID: 19152030
-
Accurate Langevin approaches to simulate Markovian channel dynamics.Phys Biol. 2015 Sep 25;12(6):061001. doi: 10.1088/1478-3975/12/6/061001. Phys Biol. 2015. PMID: 26403205 Review.
-
The what and where of adding channel noise to the Hodgkin-Huxley equations.PLoS Comput Biol. 2011 Nov;7(11):e1002247. doi: 10.1371/journal.pcbi.1002247. Epub 2011 Nov 17. PLoS Comput Biol. 2011. PMID: 22125479 Free PMC article. Review.
Cited by
-
Data-driven inference for stationary jump-diffusion processes with application to membrane voltage fluctuations in pyramidal neurons.J Math Neurosci. 2019 Jul 26;9(1):6. doi: 10.1186/s13408-019-0074-3. J Math Neurosci. 2019. PMID: 31350644 Free PMC article.
-
A temperature rise reduces trial-to-trial variability of locust auditory neuron responses.J Neurophysiol. 2015 Sep;114(3):1424-37. doi: 10.1152/jn.00980.2014. Epub 2015 Jun 3. J Neurophysiol. 2015. PMID: 26041833 Free PMC article.
-
Simple, fast and accurate implementation of the diffusion approximation algorithm for stochastic ion channels with multiple states.PLoS One. 2012;7(5):e36670. doi: 10.1371/journal.pone.0036670. Epub 2012 May 22. PLoS One. 2012. PMID: 22629320 Free PMC article.
-
On the firing rate dependency of the phase response curve of rat Purkinje neurons in vitro.PLoS Comput Biol. 2015 Mar 16;11(3):e1004112. doi: 10.1371/journal.pcbi.1004112. eCollection 2015 Mar. PLoS Comput Biol. 2015. PMID: 25775448 Free PMC article.
-
Dimensional reduction in networks of non-Markovian spiking neurons: Equivalence of synaptic filtering and heterogeneous propagation delays.PLoS Comput Biol. 2019 Oct 8;15(10):e1007404. doi: 10.1371/journal.pcbi.1007404. eCollection 2019 Oct. PLoS Comput Biol. 2019. PMID: 31593569 Free PMC article.
References
-
- Johnston D, Wu SMS. Cambridge: The MIT Press; 1994. Foundations of Cellular Neurophysiology.
-
- De Schutter E, editor. Cambridge: The MIT Press; 2009. Computational Modeling Methods for Neuroscientists.
Publication types
MeSH terms
Substances
LinkOut - more resources
Full Text Sources
Molecular Biology Databases
Research Materials
