

Genome-wide association analysis identifies variants associated with nonalcoholic fatty liver disease that have distinct effects on metabolic traits
- PMID: 21423719
- PMCID: PMC3053321
- DOI: 10.1371/journal.pgen.1001324
Genome-wide association analysis identifies variants associated with nonalcoholic fatty liver disease that have distinct effects on metabolic traits
Abstract
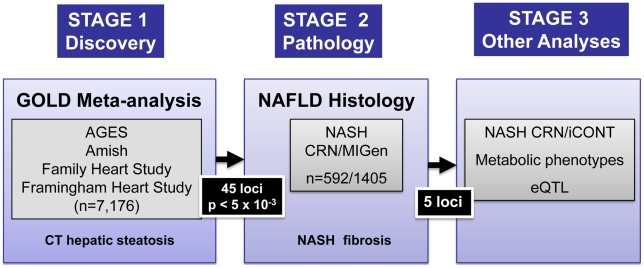
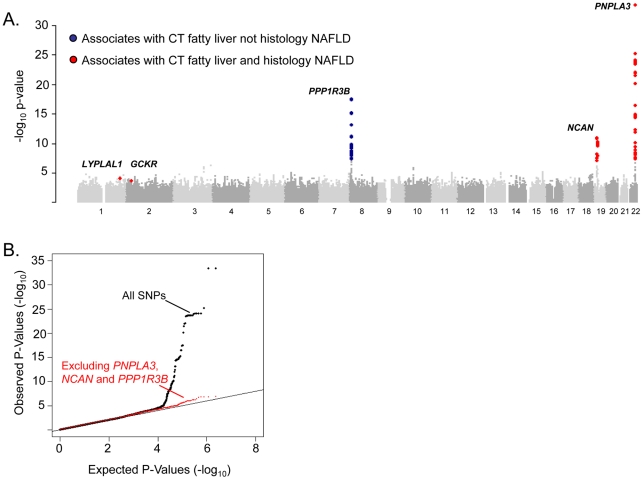
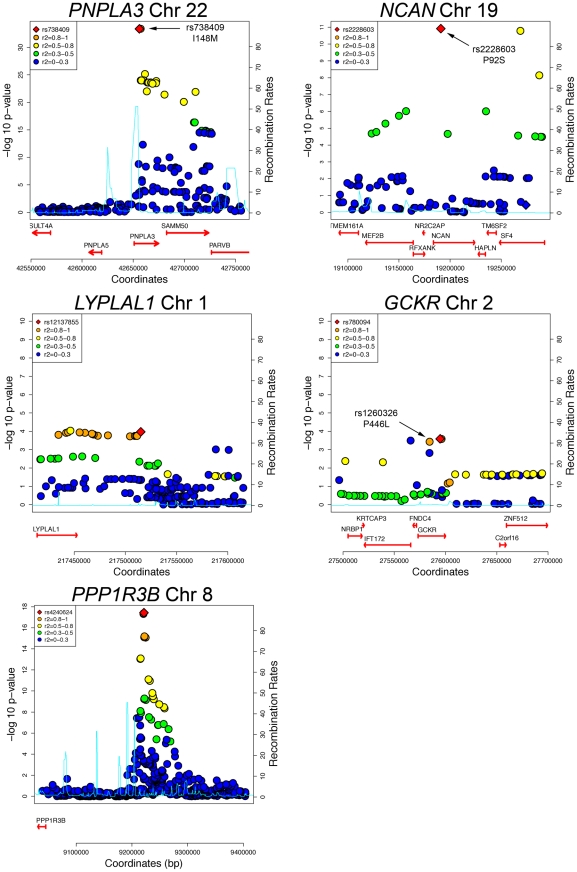
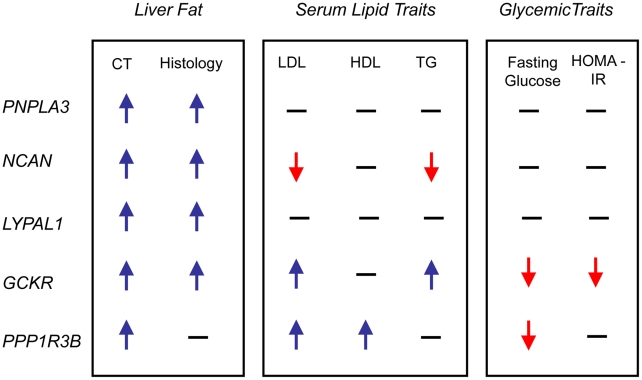
Nonalcoholic fatty liver disease (NAFLD) clusters in families, but the only known common genetic variants influencing risk are near PNPLA3. We sought to identify additional genetic variants influencing NAFLD using genome-wide association (GWA) analysis of computed tomography (CT) measured hepatic steatosis, a non-invasive measure of NAFLD, in large population based samples. Using variance components methods, we show that CT hepatic steatosis is heritable (∼26%-27%) in family-based Amish, Family Heart, and Framingham Heart Studies (n = 880 to 3,070). By carrying out a fixed-effects meta-analysis of genome-wide association (GWA) results between CT hepatic steatosis and ∼2.4 million imputed or genotyped SNPs in 7,176 individuals from the Old Order Amish, Age, Gene/Environment Susceptibility-Reykjavik study (AGES), Family Heart, and Framingham Heart Studies, we identify variants associated at genome-wide significant levels (p<5×10(-8)) in or near PNPLA3, NCAN, and PPP1R3B. We genotype these and 42 other top CT hepatic steatosis-associated SNPs in 592 subjects with biopsy-proven NAFLD from the NASH Clinical Research Network (NASH CRN). In comparisons with 1,405 healthy controls from the Myocardial Genetics Consortium (MIGen), we observe significant associations with histologic NAFLD at variants in or near NCAN, GCKR, LYPLAL1, and PNPLA3, but not PPP1R3B. Variants at these five loci exhibit distinct patterns of association with serum lipids, as well as glycemic and anthropometric traits. We identify common genetic variants influencing CT-assessed steatosis and risk of NAFLD. Hepatic steatosis associated variants are not uniformly associated with NASH/fibrosis or result in abnormalities in serum lipids or glycemic and anthropometric traits, suggesting genetic heterogeneity in the pathways influencing these traits.
Conflict of interest statement
Eric E. Schadt is an employee of Pacific Biosciences.
Figures
References
-
- Clark JM. The epidemiology of nonalcoholic fatty liver disease in adults. J Clin Gastroenterol. 2006;40:S5–10. - PubMed
-
- Kleiner DE, Brunt EM, Van Natta M, Behling C, Contos MJ, et al. Design and validation of a histological scoring system for nonalcoholic fatty liver disease. Hepatology. 2005;41:1313–1321. - PubMed
-
- Harrison SA, Neuschwander-Tetri BA. Nonalcoholic fatty liver disease and nonalcoholic steatohepatitis. Clin Liver Dis. 2004;8:861–879. - PubMed
-
- Fan JG, Zhu J, Li XJ, Chen L, Lu YS, et al. Fatty liver and the metabolic syndrome among Shanghai adults. J Gastroenterol Hepatol. 2005;20:1825–1832. - PubMed
-
- Struben VM, Hespenheide EE, Caldwell SH. Nonalcoholic steatohepatitis and cryptogenic cirrhosis within kindreds. Am J Med. 2000;108:9–13. - PubMed
Publication types
MeSH terms
Substances
Grants and funding
- R01 DK075681/DK/NIDDK NIH HHS/United States
- U01DK061728/DK/NIDDK NIH HHS/United States
- 095515/WT_/Wellcome Trust/United Kingdom
- U01 DK061734/DK/NIDDK NIH HHS/United States
- M01RR020359/RR/NCRR NIH HHS/United States
- R01HL088119/HL/NHLBI NIH HHS/United States
- M01RR000827/RR/NCRR NIH HHS/United States
- N02-HL-6-4278/HL/NHLBI NIH HHS/United States
- UL1RR02501401/RR/NCRR NIH HHS/United States
- N01-HC-25195/HC/NHLBI NIH HHS/United States
- U01 DK061737/DK/NIDDK NIH HHS/United States
- T32 DK07191-32/DK/NIDDK NIH HHS/United States
- K23 DK080145/DK/NIDDK NIH HHS/United States
- U01 DK061713/DK/NIDDK NIH HHS/United States
- G0801056/MRC_/Medical Research Council/United Kingdom
- UL1 RR024989/RR/NCRR NIH HHS/United States
- K01 DK067207/DK/NIDDK NIH HHS/United States
- F32AR059469/AR/NIAMS NIH HHS/United States
- U01DK061713/DK/NIDDK NIH HHS/United States
- MC_UP_A620_1015/MRC_/Medical Research Council/United Kingdom
- K23DK080145-01/DK/NIDDK NIH HHS/United States
- N01 AG012100/AG/NIA NIH HHS/United States
- U01 DK061732/DK/NIDDK NIH HHS/United States
- MC_UP_A100_1003/MRC_/Medical Research Council/United Kingdom
- G19/35/MRC_/Medical Research Council/United Kingdom
- PG/09/002/26056/BHF_/British Heart Foundation/United Kingdom
- U01DK061731/DK/NIDDK NIH HHS/United States
- T32 DK007191/DK/NIDDK NIH HHS/United States
- K24 DK002957/DK/NIDDK NIH HHS/United States
- U01 HL72515/HL/NHLBI NIH HHS/United States
- G1000758/MRC_/Medical Research Council/United Kingdom
- F32 DK079466-01/DK/NIDDK NIH HHS/United States
- U01DK061737/DK/NIDDK NIH HHS/United States
- G0100222/MRC_/Medical Research Council/United Kingdom
- MC_U127561128/MRC_/Medical Research Council/United Kingdom
- U01 DK061731/DK/NIDDK NIH HHS/United States
- U01 DK061718/DK/NIDDK NIH HHS/United States
- R01DK075787/DK/NIDDK NIH HHS/United States
- M01RR000065/RR/NCRR NIH HHS/United States
- M01 RR000188/RR/NCRR NIH HHS/United States
- G8802774/MRC_/Medical Research Council/United Kingdom
- R01 AG18728/AG/NIA NIH HHS/United States
- G1000143/MRC_/Medical Research Council/United Kingdom
- T32 AG000262/AG/NIA NIH HHS/United States
- G0902037/MRC_/Medical Research Council/United Kingdom
- F32 DK079466/DK/NIDDK NIH HHS/United States
- R01 DK075787/DK/NIDDK NIH HHS/United States
- U01DK061718/DK/NIDDK NIH HHS/United States
- U01DK061732/DK/NIDDK NIH HHS/United States
- M01 RR000750/RR/NCRR NIH HHS/United States
- MC_UP_A620_1014/MRC_/Medical Research Council/United Kingdom
- MC_U106179471/MRC_/Medical Research Council/United Kingdom
- U01 HL084756/HL/NHLBI NIH HHS/United States
- T32AG000262/AG/NIA NIH HHS/United States
- U01 DK061730/DK/NIDDK NIH HHS/United States
- P30 DK072488/DK/NIDDK NIH HHS/United States
- R01HL087700/HL/NHLBI NIH HHS/United States
- N01 HC025195/HL/NHLBI NIH HHS/United States
- U01 DK061728/DK/NIDDK NIH HHS/United States
- G0401527/MRC_/Medical Research Council/United Kingdom
- ULRR02413101/PHS HHS/United States
- G0701863/MRC_/Medical Research Council/United Kingdom
- M01 RR000065/RR/NCRR NIH HHS/United States
- P60 DK079637/DK/NIDDK NIH HHS/United States
- 090532/WT_/Wellcome Trust/United Kingdom
- R01DK075681/DK/NIDDK NIH HHS/United States
- U01 HL072515/HL/NHLBI NIH HHS/United States
- U01 DK061738/DK/NIDDK NIH HHS/United States
- UL1RR024989/RR/NCRR NIH HHS/United States
- ImNIH/Intramural NIH HHS/United States
- F32 AR059469/AR/NIAMS NIH HHS/United States
- U01DK061738/DK/NIDDK NIH HHS/United States
- M01 RR000827/RR/NCRR NIH HHS/United States
- M01RR00188/RR/NCRR NIH HHS/United States
- U01DK061734/DK/NIDDK NIH HHS/United States
- R01 HL087700/HL/NHLBI NIH HHS/United States
- R01 AG018728/AG/NIA NIH HHS/United States
- P30DK072488/DK/NIDDK NIH HHS/United States
- U01DK061730/DK/NIDDK NIH HHS/United States
- R01 HL088119/HL/NHLBI NIH HHS/United States
- M01 RR020359/RR/NCRR NIH HHS/United States
- M01RR000750/RR/NCRR NIH HHS/United States
- RG/07/008/23674/BHF_/British Heart Foundation/United Kingdom
LinkOut - more resources
Full Text Sources
- Archivio Istituzionale della Ricerca Unimi - Access Free Full Text
- Europe PubMed Central
- PubMed Central
- Public Library of Science
- Spiral, Imperial College Digital Repository
- University of Western Australia Profiles and Research Repository
- eScholarship, University of California - Access Free Full Text
Other Literature Sources
Medical
Miscellaneous
