. 2011 Mar 14;6(3):e14752.
doi: 10.1371/journal.pone.0014752.

Predicting pancreas cell fate decisions and reprogramming with a hierarchical multi-attractor model

Affiliations

Predicting pancreas cell fate decisions and reprogramming with a hierarchical multi-attractor model

Joseph Xu Zhou et al. PLoS One. .

Abstract

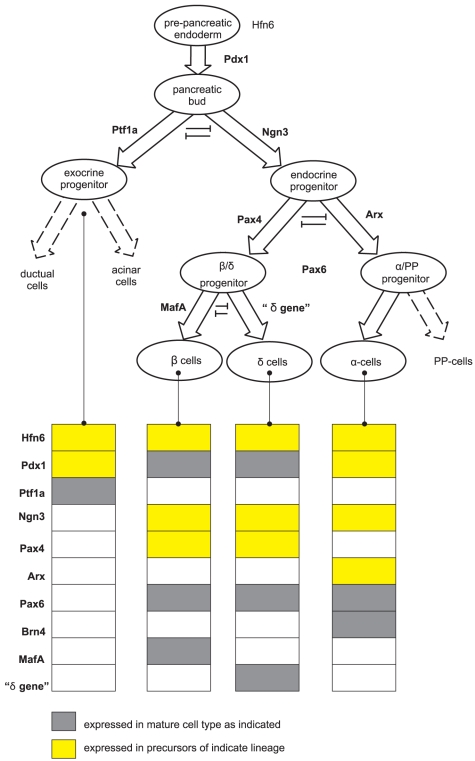
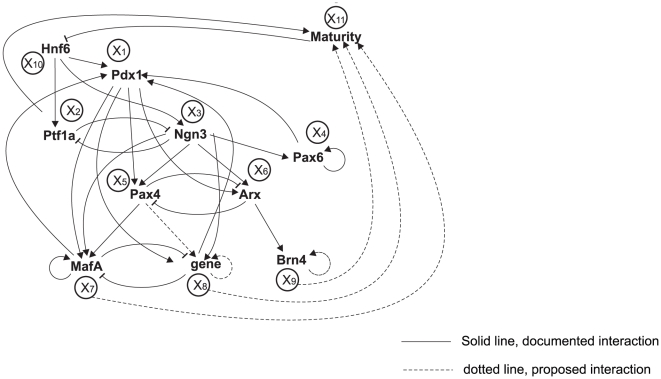
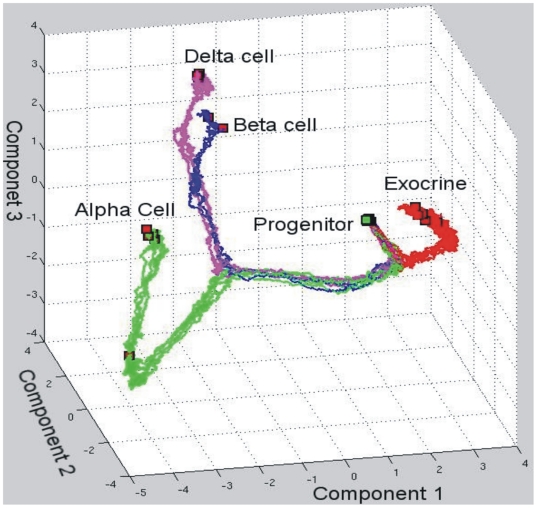
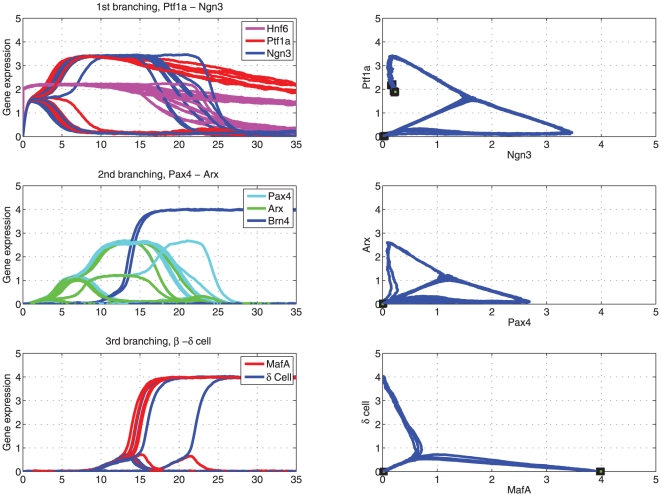
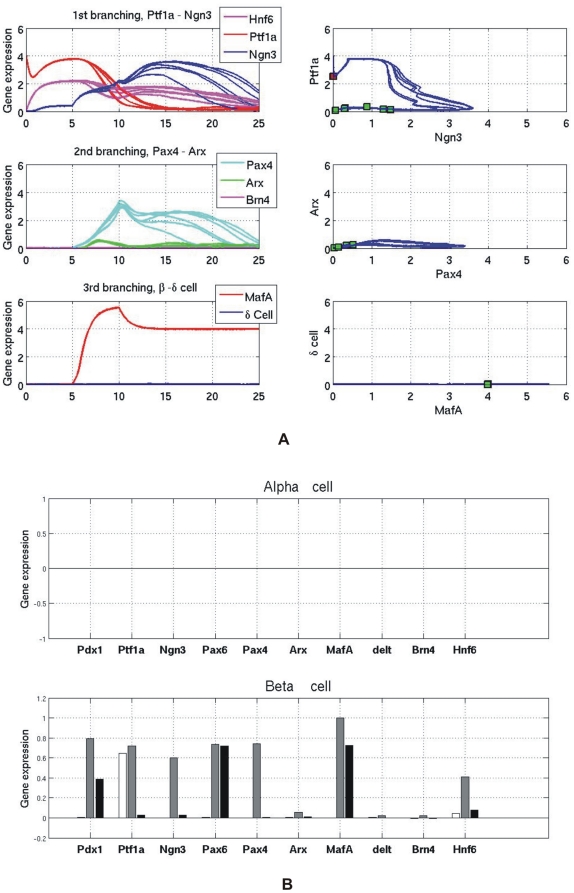
Cell fate reprogramming, such as the generation of insulin-producing β cells from other pancreas cells, can be achieved by external modulation of key transcription factors. However, the known gene regulatory interactions that form a complex network with multiple feedback loops make it increasingly difficult to design the cell reprogramming scheme because the linear regulatory pathways as schemes of causal influences upon cell lineages are inadequate for predicting the effect of transcriptional perturbation. However, sufficient information on regulatory networks is usually not available for detailed formal models. Here we demonstrate that by using the qualitatively described regulatory interactions as the basis for a coarse-grained dynamical ODE (ordinary differential equation) based model, it is possible to recapitulate the observed attractors of the exocrine and β, δ, α endocrine cells and to predict which gene perturbation can result in desired lineage reprogramming. Our model indicates that the constraints imposed by the incompletely elucidated regulatory network architecture suffice to build a predictive model for making informed decisions in choosing the set of transcription factors that need to be modulated for fate reprogramming.


Conflict of interest statement

Competing Interests: The authors have declared that no competing interests exist.

Figures

Figure 1
Figure 1. Cell lineages of pancreatic cell differentiation and their gene expression patterns.
Mouse pancreas development starts from the Pdx1 + cells, which gradually differentiate into exocrine, α, β and δ cells. Genes marked with yellow color are transiently expressed while those with grey color are permanently expressed in mature cells.
Figure 2
Figure 2. Gene regulatory network for pancreatic cell differentiation.
Master model: Hnf6 activates Pdx1, Ptf1a and Ngn3. Three cross-inhibition gene pairs are Ptf1a-Ngn3, Pax4-Arx and MafA-δ gene. Nodes are denoted by TF names. Arrow-heads denote activation while flat-heads denote inhibition. Circles are variable names in the mathematical model. An alternative model: Pdx1 directly inhibits both Ptf1a and Ngn3.
Figure 3
Figure 3. Three branchings of gene expression profiles during pancreatic cell differentiation.
This figure describes the dynamics of three bifurcations happened between three cross-inhibition gene switches: (A) Ptf1a - Ngn3, (B) Pax4 - Arx (C) MafA - δ cell gene. The left panels show gene expression profiles. The right panels show phase diagrams of the cross-inhibition genes.
Figure 4
Figure 4. Trajectories of three pancreatic cell differentiations in the phase space.
The three coordinates are the three largest components of principle components analysis (PCA) of all trajectories of pancreatic cell differentiation. We run our model in cell population and record gene expression trajectories of all cells. Then we employ PCA to analyze these data and choose three largest components for visualization.
Figure 5
Figure 5. Temporal gene expression profile during pancreatic cell differentiation.
In this figure different colors denote different genes. (A) Experimental observations of both gene expression levels and timing are qualitative reported in . (B) Simulation results from the master model. (C) Simulation result of an alternative model with the inhibitory effects of Pdx1 upon Ngn3 and Ptf1a.
Figure 6
Figure 6. The gene expression profiles of knock out simulations.
(A) The case of knocking out Pax4: α cell marker Brn4 is expressed while no MafA and δ cell gene are expressed; (B) The case of knocking out Arx: MafA and δ cell gene are expressed while Brn4 is not expressed.
Figure 7
Figure 7. Noisy gene expression profiles after knocking out Pdx1.
(A) Because all fully differentiated cells have a positive feedback, their marker genes can be activated by noise. Exocrine, α, β and δ cells appear, but their steady state gene expression patterns are different from the normal cells. (B) Noisy gene expression patterns of Exocrine, α, β and δ cells after knocking out Pdx1. White – Initial values; Gray – Maximum value; Black – Final value.
Figure 8
Figure 8. The gene expression profiles of cell reprogramming with the recipe Pdx1, Ngn3 and MafA.
(A) Gene expression profiles of pancreatic exocrine cells being reprogrammed to β cells. Three genes, Pdx1, Ngn3 and MafA are over-expressed as the extra production terms in the model. Besides β cells appear, α cells also appear after reprogramming. (B) Ten gene expression patterns in reprogrammed pancreas α and β cells with the recipe: Pdx1, Ngn3 and MafA. White – Initial values; Gray – Maximum value; Black – Final value.
Figure 9
Figure 9. The gene expression profiles of cell reprogramming with the recipe Pdx1, Ngn3, Pax4 and MafA.
(A) Gene expression profiles of pancreatic exocrine cells being reprogrammed to β cells. Four genes, Pdx1, Ngn3, Pax4 and MafA are over-expressed as the extra production terms in the model. Only β cells appear after the cell reprogramming. No α cells appear since they are repressed with the introduction of the gene Pax4. (B) Ten gene expression patterns in reprogrammed pancreas β cell with the recipe: Pdx1, Ngn3, MafA and Pax4. White – Initial values; Gray – Maximum value; Black – Final value.

Similar articles

Cited by

References

    1. Davidson EH, Erwin DH. Gene regulatory networks and the evolution of animal body plans. Science. 2006;311:796–800. - PubMed
    1. Huang S, Eichler G, Bar-Yam Y, Ingber DE. Cell fates as high-dimensional attractor states of a complex gene regulatory network. Phys Rev Lett. 2005;94:128701. - PubMed
    1. Huang S. Reprogramming cell fates: reconciling rarity with robustness. Bioessays. 2009;31:546–560. - PubMed
    1. Macarthur BD, Ma'ayan A, Lemischka IR. Systems biology of stem cell fate and cellular reprogramming. Nat Rev Mol Cell Biol. 2009;10:672–681. - PMC - PubMed
    1. Chang HH, Hemberg M, Barahona M, Ingber DE, Huang S. Transcriptome-wide noise controls lineage choice in mammalian progenitor cells. Nature. 2008;453:544–547. - PMC - PubMed

Publication types