. 2011 Mar 14;6(3):e17009.
doi: 10.1371/journal.pone.0017009.

Beaked whales respond to simulated and actual navy sonar

Affiliations

Beaked whales respond to simulated and actual navy sonar

Peter L Tyack et al. PLoS One. .

Abstract

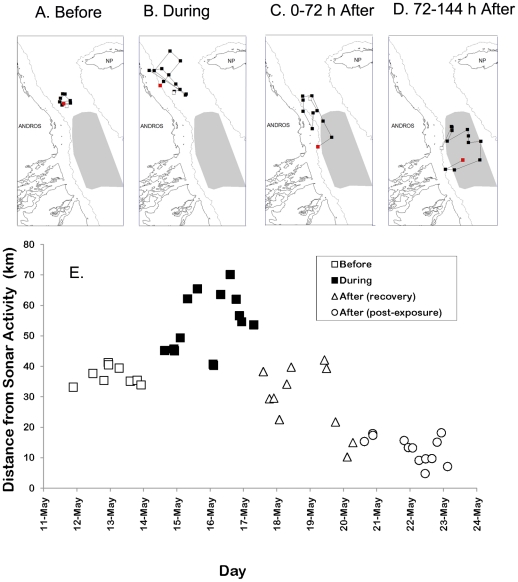
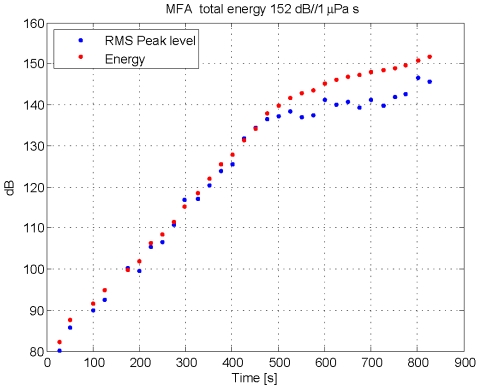
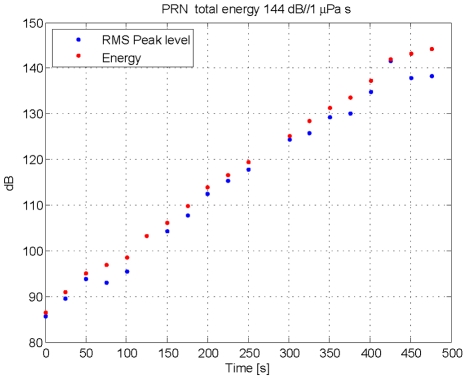
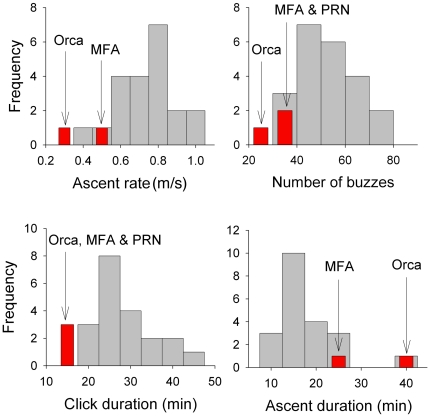
Beaked whales have mass stranded during some naval sonar exercises, but the cause is unknown. They are difficult to sight but can reliably be detected by listening for echolocation clicks produced during deep foraging dives. Listening for these clicks, we documented Blainville's beaked whales, Mesoplodon densirostris, in a naval underwater range where sonars are in regular use near Andros Island, Bahamas. An array of bottom-mounted hydrophones can detect beaked whales when they click anywhere within the range. We used two complementary methods to investigate behavioral responses of beaked whales to sonar: an opportunistic approach that monitored whale responses to multi-day naval exercises involving tactical mid-frequency sonars, and an experimental approach using playbacks of simulated sonar and control sounds to whales tagged with a device that records sound, movement, and orientation. Here we show that in both exposure conditions beaked whales stopped echolocating during deep foraging dives and moved away. During actual sonar exercises, beaked whales were primarily detected near the periphery of the range, on average 16 km away from the sonar transmissions. Once the exercise stopped, beaked whales gradually filled in the center of the range over 2-3 days. A satellite tagged whale moved outside the range during an exercise, returning over 2-3 days post-exercise. The experimental approach used tags to measure acoustic exposure and behavioral reactions of beaked whales to one controlled exposure each of simulated military sonar, killer whale calls, and band-limited noise. The beaked whales reacted to these three sound playbacks at sound pressure levels below 142 dB re 1 µPa by stopping echolocation followed by unusually long and slow ascents from their foraging dives. The combined results indicate similar disruption of foraging behavior and avoidance by beaked whales in the two different contexts, at exposures well below those used by regulators to define disturbance.


Conflict of interest statement

Competing Interests: While the sponsors of this study come from an international mix of sound producers and a United States regulatory agency, the majority of funding for the research reported here comes from different divisions of the U.S. Navy, and all of the authors have had at least some of the research reported here partially funded by different divisions of the U.S. Navy. The following authors are employed by the U.S. Navy: David Moretti, Angela D'Amico, Nancy DiMarzio, Susan Jarvis, Elena McCarthy, Ronald Morrissey, and Jessica Ward. Their primary involvement was in designing, installing, and helping to operate the passive acoustic marine mammal monitoring system at the AUTEC range; providing the sound sources used in the experiments; and with analyzing and writing up the data. During the time period covered by this research the following authors were employed by the National Marine Fisheries Service of the U.S. National Oceanic and Atmospheric Administration, which acts as the federal regulatory agency for protection of marine mammals: Brandon Southall and John Durban. The following authors have been asked by the U.S. Department of Justice to act as expert witnesses in cases involving the effects of naval sonar on marine mammals: Christopher Clark, Brandon Southall, and Peter Tyack. Peter Tyack is a member of Natural Resources Defense Council, which is an advocacy organization that has sued the Navy concerning effects of sonar on marine mammals. None of the analysis nor write up of the paper involved or was influenced by the sponsors of the research.

Figures

Figure 1
Figure 1. Maps of the AUTEC hydrophone array indicating presence of beaked whales.
Hydrophones that detected Blainville's beaked whale clicks are circled in red. (A) Hydrophones that detected whales during 20 h before a sonar exercise from May 2007. (B) Hydrophones that detected whales over 23 h during the exercise. (C) Hydrophones that detected whales during 22 h after the exercise stopped. Fewer hydrophones detected beaked whales during the sonar exercise compared to before and after, with no detections in the center of the range during sonar operations.
Figure 2
Figure 2. Variation in Group Clicking Periods (GCP) of Blainville's beaked whales exposed to sonar exercises.
GCPs were defined by detections of beaked whale clicks within a cluster of hydrophones, representing synchronized deep foraging dives of a group of beaked whales.
Figure 3
Figure 3. Locations of a Blainville's beaked whale satellite tagged before a naval sonar exercise in the AUTEC range in May 2009.
For each segment of the track in subplots A–D, the start is plotted with a white square and the end is marked with a red square. The shaded area indicates the extent of the AUTEC range hydrophone array. (A) Locations recorded 72 h before a sonar exercise started on the AUTEC range. (B) Locations recorded during the 72 h sonar exercise. (C) Locations recorded 72 h after the exercise ended. (D) Locations recorded between 72 and 144 h after the exercise ended. (E) Distance from each location to the center of the AUTEC range as a function of date.
Figure 4
Figure 4. Whale acoustic activity and dive behavior before, during and after sound playback experiments.
Deep foraging dives of one beaked whale tagged in 2007 (A–C) and another beaked whale tagged in 2008 (E–G) with the time of each dive indicated on the x-axis. The segment of the dive when the whale was clicking is indicated by coloring the dive profile blue. (A) This first dive after tagging was a pre-exposure dive. (B) This second dive after tagging involved playback of the MFA sonar stimulus, with slowly increasing level of playback. The red dots mark the received sound pressure level of the playback signal as recorded on the whale (in dBrms re 1 µPa averaged over a 200 msec window). (C) This third dive involved playback of killer whale (ORCA) sounds. The received level of the ORCA playback signal indicated by the red dots is the third octave band with the most energy averaged over a 200 msec. (D) The horizontal component of the motion of the tagged whale exposed to playbacks in 2007 is plotted in the dark gray and colored lines. Deep foraging dives are marked in green, and playback sound exposure is indicated in red. Tracks of three other beaked whales tagged during baseline conditions when no sonar was transmitting are shown in light gray for comparison. All tracks are presented with respect to the same arbitrary start position at (0, 0). Note that none of the baseline tracks contain segments as linear as the avoidance response of the whale after playback of killer whale sounds. (E–F) These first two dives after tagging in 2008 were pre-exposure dives. (G) The third dive after tagging in 2008 involved playback of the PRN sound stimulus, with slowly increasing level of playback. The red dots mark the increasing received sound pressure level of the playback signal (in dBrms re 1 µPa averaged over a 200 msec window).
Figure 5
Figure 5. Exposure to MFA sonar pings during the playback in 2007.
The blue dots indicate the highest sound pressure level (SPL) in 200 msec windows of each MFA ping in dB re 1 µPa. The energy within the whole ping integrated over 2 s in dB re 1 µPa2 s is integrated over all earlier pings to provide a cumulative Sound Exposure Level (SEL) indicated by the red dots. The overall SEL for the entire exposure is calculated by integrating energy of all the pings and is 152 dB re 1 µPa2 s.
Figure 6
Figure 6. Exposure to PRN pings during the playback in 2008.
The blue dots indicate the highest sound pressure level (SPL) in 200 msec windows of each PRN ping in dB re 1 µPa. The energy within the whole ping integrated over 2 s in dB re 1 µPa2 s is integrated over all earlier pings to provide a cumulative Sound Exposure Level (SEL) indicated by the red dots. The overall SEL for the entire exposure is calculated by integrating energy of all the pings and is 144 dB re 1 µPa2 s.
Figure 7
Figure 7. Histograms of the four significant response parameters from the beaked whale playbacks.
Exposure dives are indicated in red and baseline dives in gray.
Figure 8
Figure 8. Illustration of the method used to estimate acoustic exposure for beaked whale sounds.
Top: Spectrogram of regular echolocation clicks and a buzz from a tagged Mesoplodon densirostris at AUTEC. Low-frequency flow noise from swimming motions is also visible below 1 kHz. Bottom: Calculation of RMS sound levels in the 1/3rd-octave band in dB re 1 µPa used for the analysis of the MFA and PRN signal (3111–3920 Hz). The thin black line uses a 10 msec window for calculating RMS, the thicker blue line uses a 200 msec window. The algorithm that calculates RMS over the 200 msec window includes a routine that rejects energy from short echolocation clicks.
Figure 9
Figure 9. Illustration of the method used to estimate acoustic exposure for MFA sonar sounds.
Top: Spectrogram of a mid-frequency sonar signal (MFA) broadcast during sound playback in September 2007 as recorded on a tagged Mesoplodon densirostris. The direct arrival of the playback signal occurred at time 4.2–5.5 sec; sound energy at the same frequency later in the spectrogram represents reverberation of this signal arriving from other paths such as reflections from the surface and the seafloor. Low-frequency flow noise from swimming motions is also visible below 1 kHz. Bottom: Calculation of RMS sound levels in dB re 1 µPa in the 1/3rd-octave band used for the analysis of the MFA and PRN signal (3111–3920 Hz). The thin black line uses a 10 msec window for calculating RMS, the thicker blue line uses a 200 msec window.
Figure 10
Figure 10. Illustration of the method used to estimate acoustic exposure for killer whale sounds.
Top: Spectrogram of a killer whale (Orcinus orca) signal broadcast during sound playback in September 2007 as recorded on a tagged Mesoplodon densirostris. The main killer whale signal occurred between 0.75–1.5 sec. The tagged whale produced a buzz from 6–9.5 sec. Bottom: Calculation of RMS sound levels in dB re 1 µPa. The thin black line shows the results from using a 10 msec window for calculating RMS, the colored lines indicate RMS energy in 1/3rd-octave bands between 2 and 5 kHz over a 200 msec window. The blue line indicates the 1/3rd-octave band between 1960–2467 Hz, the green line indicates the 1/3rd-octave band between 2467–3111 Hz, the red line indicates the 1/3rd-octave band between 3111–3920 Hz, and the cyan line indicates the 1/3rd-octave band between 3920–4939.
Figure 11
Figure 11. Illustration of the method used to estimate acoustic exposure for pseudo-random noise.
Top: Spectrogram of a pseudorandom noise (PRN) signal broadcast during sound playback in September 2008 as recorded on a tagged Mesoplodon densirostris. The direct arrival of the playback signal occurred at time 5.5–7 sec; sound energy at the same frequency later in the spectrogram represents reverberation of this signal arriving from other paths such as reflections from the surface and the seafloor. Low-frequency flow noise from swimming motions is also visible below 1 kHz. Bottom: Calculation of RMS sound levels in dB re 1 µPa based on a single 1/3rd-octave band (3111–3920 Hz). The thin black line shows the results using a 10 msec window for calculating RMS, the thicker blue line used a 200 msec window.

Similar articles

Cited by

References

    1. Slabbekoorn H, Ripmeester EAP. Birdsong and anthropogenic noise: implications and applications for conservation. Mol Ecol. 2008;17:72–83. DOI: 10.1111/j.1365-294X.2007.03487.x. - DOI - PubMed
    1. Lengagne T. Traffic noise affects communication behaviour in a breeding anuran, Hyla arborea. Biol Cons. 2008;141:2023–2031. DOI: 10.1016/j.biocon.2008.05.017. - DOI
    1. Myrberg AA., Jr The effects of man-made noise on the behavior of marine animals. Environ Int. 1990;16:575–586. DOI: 10.1016/0160-4120(90)90028-5. - DOI
    1. Slabbekoorn H, Bouton N, van Opzeeland I, Coers A, ten Cate C, et al. A noisy spring: the impact of globally rising underwater sound levels on fish. Trends Ecol Evol. 2010;25:419–427. DOI: 10.1016/j.tree.2010.04.005. - DOI - PubMed
    1. Payne R, Webb D. Orientation by means of long range acoustic signaling in baleen whales. Ann NY Acad Sci. 1971;188:110–141. - PubMed

Publication types