. 2011 Mar 14;6(3):e17522.
doi: 10.1371/journal.pone.0017522.

TGF-β inducible early gene 1 regulates osteoclast differentiation and survival by mediating the NFATc1, AKT, and MEK/ERK signaling pathways

Affiliations

TGF-β inducible early gene 1 regulates osteoclast differentiation and survival by mediating the NFATc1, AKT, and MEK/ERK signaling pathways

Muzaffer Cicek et al. PLoS One. .

Abstract

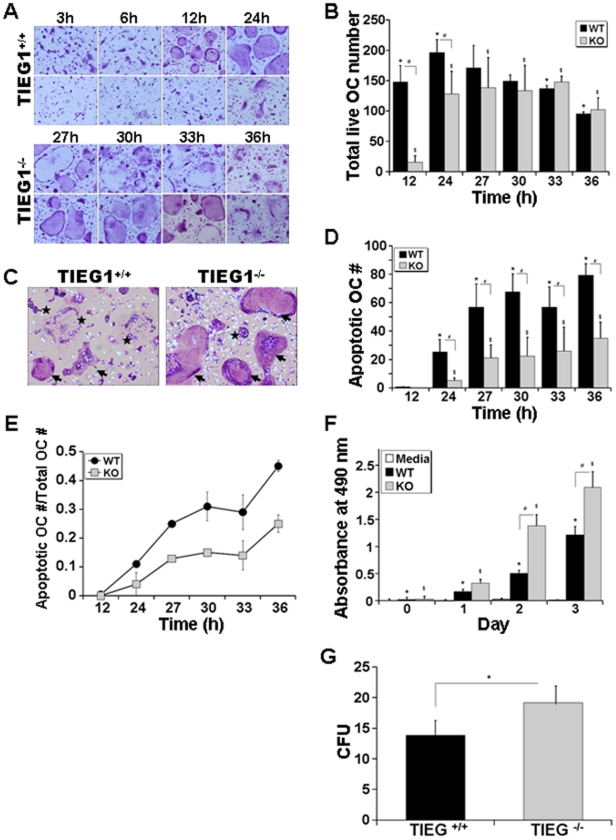
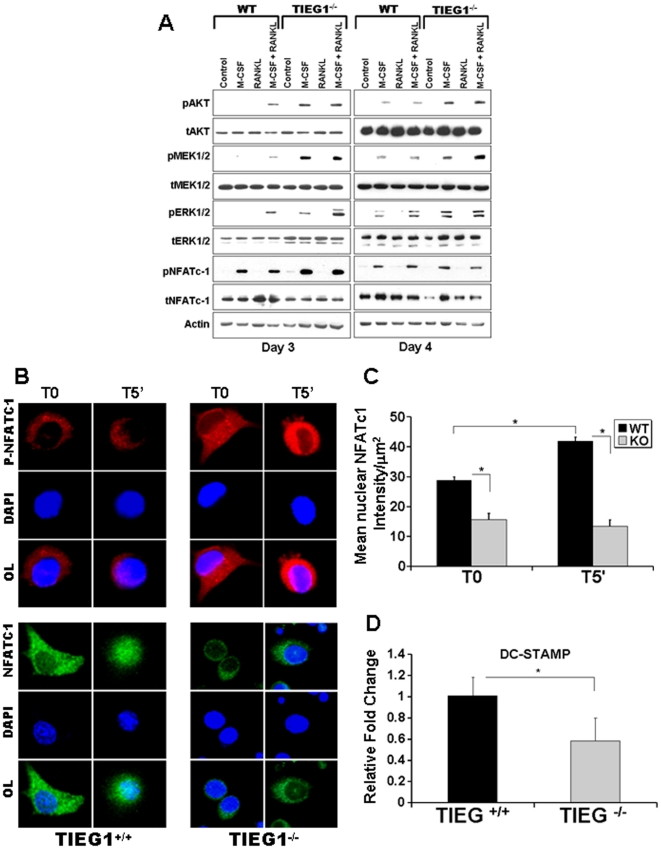
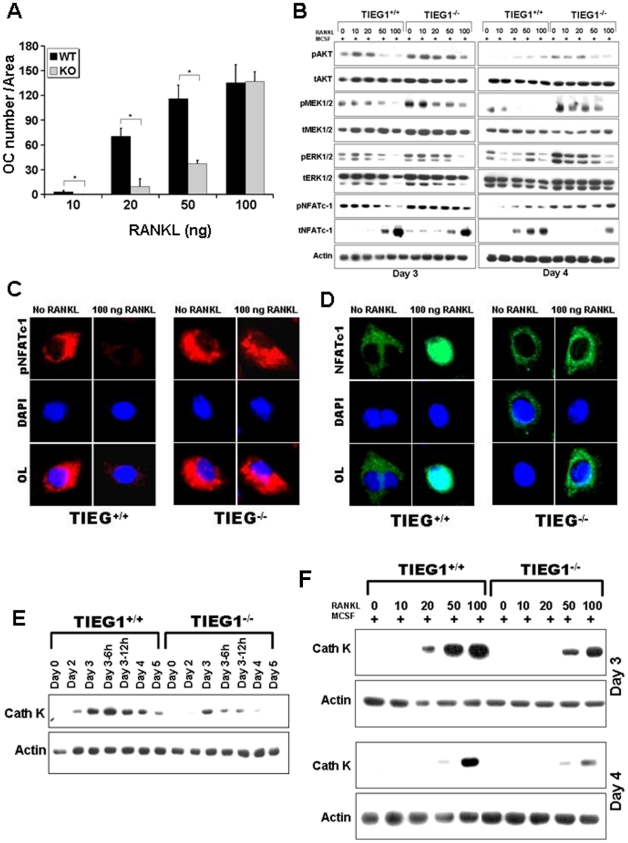
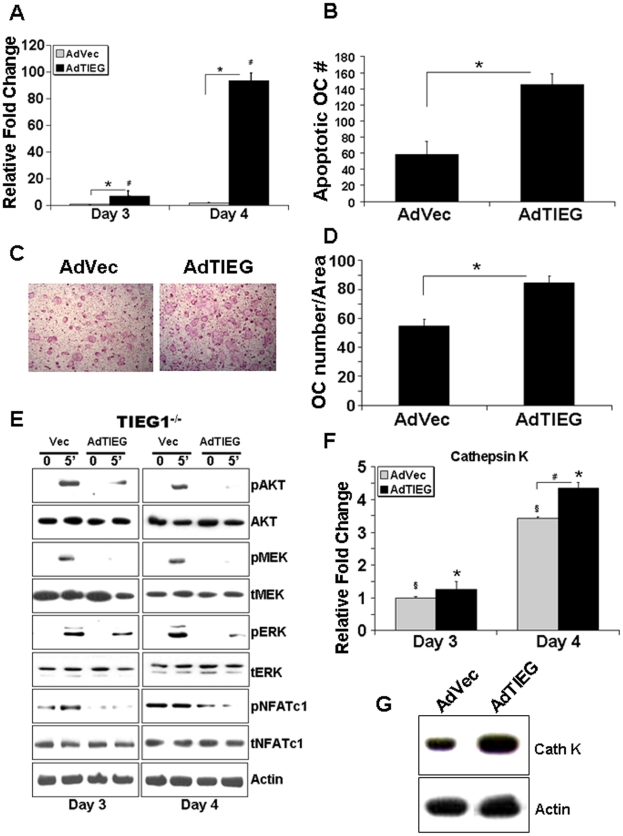
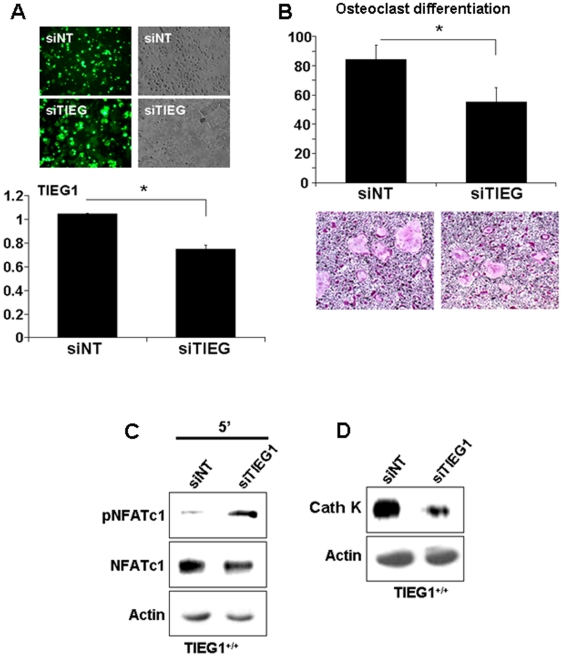
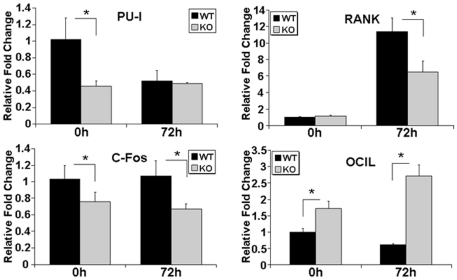
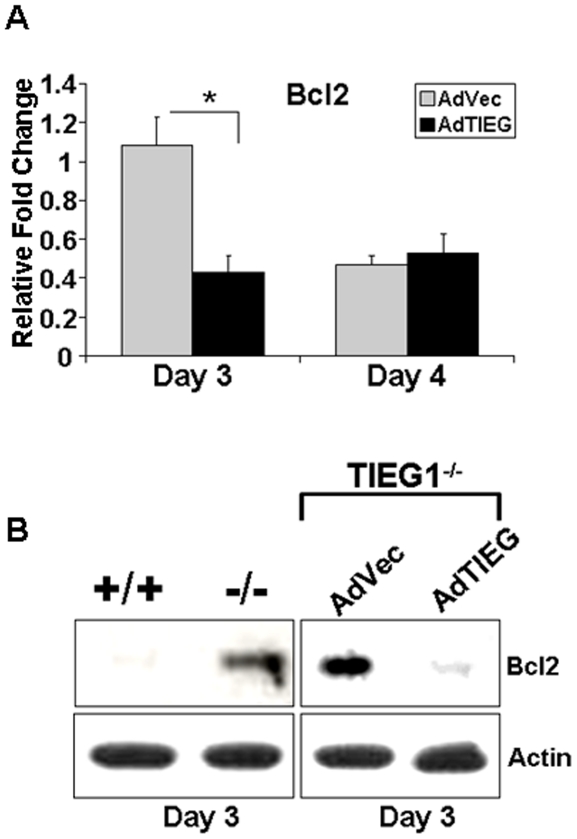
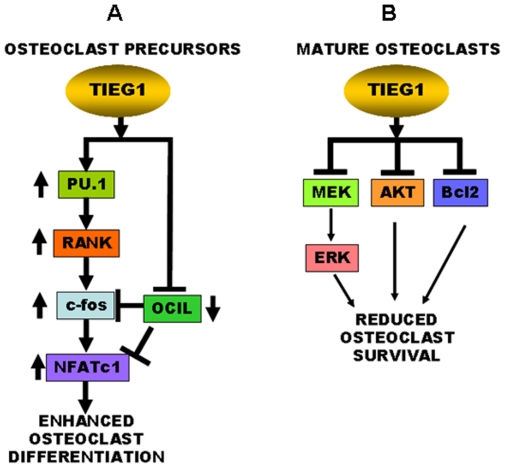
TGF-β Inducible Early Gene-1 (TIEG1) is a Krüppel-like transcription factor (KLF10) that was originally cloned from human osteoblasts as an early response gene to TGF-β treatment. As reported previously, TIEG1(-/-) mice have decreased cortical bone thickness and vertebral bone volume and have increased spacing between the trabeculae in the femoral head relative to wildtype controls. Here, we have investigated the role of TIEG1 in osteoclasts to further determine their potential role in mediating this phenotype. We have found that TIEG1(-/-) osteoclast precursors differentiated more slowly compared to wildtype precursors in vitro and high RANKL doses are able to overcome this defect. We also discovered that TIEG1(-/-) precursors exhibit defective RANKL-induced phosphorylation and accumulation of NFATc1 and the NFATc1 target gene DC-STAMP. Higher RANKL concentrations reversed defective NFATc1 signaling and restored differentiation. After differentiation, wildtype osteoclasts underwent apoptosis more quickly than TIEG1(-/-) osteoclasts. We observed increased AKT and MEK/ERK signaling pathway activation in TIEG1(-/-) osteoclasts, consistent with the roles of these kinases in promoting osteoclast survival. Adenoviral delivery of TIEG1 (AdTIEG1) to TIEG1(-/-) cells reversed the RANKL-induced NFATc1 signaling defect in TIEG1(-/-) precursors and eliminated the differentiation and apoptosis defects. Suppression of TIEG1 with siRNA in wildtype cells reduced differentiation and NFATc1 activation. Together, these data provide evidence that TIEG1 controls osteoclast differentiation by reducing NFATc1 pathway activation and reduces osteoclast survival by suppressing AKT and MEK/ERK signaling.


Conflict of interest statement

Competing Interests: The authors have declared that no competing interests exist.

Figures

Figure 1
Figure 1. Lack of TIEG1 in osteoclast precursors delays osteoclast differentiation and apoptosis in vitro.
A. WT and TIEG1−/− marrow cells were cultured as described in the Methods section and subsequently fixed and stained for TRAP activity and chromatin condensation beginning on day 3 or after feeding the cells with MCSF and RANKL for the indicated time in hours (h). These data are representative of three separate experiments. B. Mean +/− SD of viable osteoclasts over time. These data were obtained from four replicate wells (p<0.05) and are representative of three separate experiments. C. Image of TRAP and Hoechst stained osteoclasts on day 4. Viable osteoclasts are indicated with an arrow and apoptotic osteoclasts are indicated with a star. These data are representative of three separate experiments. D. Mean +/− SD of the number of apoptotic osteoclasts on day 3 after feeding the cells with MCSF and RANKL for the indicated time in hours. Note that apoptosis is not observed until day 4 (24 h after feeding on day 3). E. The ratio of apoptotic osteoclasts to total number of osteoclasts is also presented as mean +/− SD. These data were obtained from four replicate wells. (p<0.05) and are representative of three separate experiments. F. Mean +/− SD of proliferation of WT and TIEG1−/− osteoclast progenitors. WT and TIEG1−/− non-adherent bone marrow cells were seeded at 1×10⁵ cells/well in 96-well plates and grown at 37°C for 3 h at day 0, 1, 2 and 3 of differentiation. Proliferation was determined using an absorbance of 490 nm and the CellTiter 96® AQueous One Solution Assay kit. These data were obtained from eight replicate wells (p<0.05) and are representative of three separate experiments. G. The mean +/− SD of number of colony forming units (CFU)-GM. These data are from three replicate wells (p<0.05) and are representative of three separate experiments.
Figure 2
Figure 2. Signaling pathway analysis following MCSF and RANKL treatment.
A. Osteoclast precursors at day 3 and mature osteoclasts at day 4 were serum-starved and treated with MCSF, RANKL or MCSF+RANKL as indicated for five minutes. Equal amounts of total protein were analyzed by western blotting for the indicated phospho (p) or total (t) proteins. These data are representative of two separate experiments. For each experiment, marrow cells from three mice were pooled and analyzed in three replicate wells. The data are presented as the mean +/− SD from all replicate wells. B. Confocal images of the effect of RANKL and MCSF treatment on phospho- NFATc1 and total NFATc1, respectively. These data are representative of two separate experiments. C. Quantitative nuclear NFATc1 was calculated at T0 and T5′ after RANKL and MCSF treatment. Precursors were cultured with MCSF and RANKL as in Figure 1. On day 3, the cells were rinsed and serum starved for 1 hour prior to ether fixing (T0) or 5 minutes (T5′) of treatment with M-CSF and RANKL. These data are representative of two separate experiments and each experiment is analyzed in three replicate wells. D. Loss of TIEG1 expression results in decreased DC-STAMP expression in pre-fusion day 3 precursors compared to WT day 3 precursors. These data are representative of two separate experiments. For each experiment, marrow cells from three mice were pooled and analyzed in three replicate wells. The data are presented as the mean +/− SD from all replicate wells.
Figure 3
Figure 3. Differentiation defects in TIEG1−/− osteoclast lineage cells results from defective RANKL responses.
A. Mean number of osteoclasts from WT and TIEG1−/− (KO) mouse marrow following 4 days of culture in the presence of 25 ng/ml MCSF and the indicated concentrations of RANKL as outlined in the Methods section. Cells were stained and the number of osteoclasts quantitated as in Figure 1 (*p<0.05). These data were obtained from three replicate wells (p<0.05) and are representative of three separate experiments. B Osteoclast precursors at day 3 and mature osteoclasts at day 4 were treated with the indicated concentration of RANKL and equal amounts of total protein were analyzed by western blotting for the indicated phospho- or total proteins. These data are representative of two separate experiments. For each experiment, marrow cells from three mice were pooled and analyzed in three replicate wells. C and D. Confocal images demonstrating the effect of RANKL on phospho- NFATc1 (C) or total NFATc1 (D). Precursors were cultured with MCSF with or without RANKL as indicated. On day 3, cells were fixed and stained with the indicated primary antibodies. These data are representative of two separate experiments and each experiment is analyzed in three replicate wells. E and F. Time course expression of cathepsin K in WT and TIEG1−/− (KO) osteoclast precursors (day 3) and mature osteoclasts (day 4) cultured in the presence of MSCF alone (E) or with the indicated concentration of RANKL (F). Precursors and mature osteoclasts were harvested and cultured as in A for the indicated time. Equal protein from cell lysates were analyzed by western blotting for cathepsin K protein expression. These data are representative of two separate experiments. For each experiment, marrow cells from three mice were pooled and analyzed in three replicate wells.
Figure 4
Figure 4. AdTIEG1 expression in TIEG1−/− OC precursors restores differentiation and signaling defects.
A. TIEG1−/− precursor osteoclasts were infected at day 2 with vector control (AdVec) or TIEG1 (AdTIEG) adenovirus (MOI = 25) and TIEG expression was monitor by real time PCR at day 3 and day 4. These data were obtained from three replicate wells and are represented as the mean +/− SD (p<0.05). B. AdTIEG1 expression effects on osteoclast apoptosis. Osteoclast precursors were cultured as in A and apoptosis determined as in Figure 1D. Mean +/− SD of the number of apoptotic osteoclasts over time are depicted. These data were obtained from three replicate wells (p<0.05) and are representative of two separate experiments. Each experiment contained marrow cells pooled from three mice. C and D. AdTIEG1 expression effects on osteoclast differentiation. Osteoclast precursors were cultured as in A. C represents TRAP-stained vector and AdTIEG1-infected TIEG1−/− osteoclasts at day 4 and D depicts the mean +/− SD of the number of osteoclasts quantitated. These data are from three replicate wells (p<0.05) and are representative of two separate experiments. Each experiment contained marrow cells pooled from three mice. E. AdTIEG1 expression effects on signaling. Osteoclast precursors were cultured as in A. Day 3 osteoclast precursors and mature osteoclasts at day 4 were serum-starved and either harvested or treated with MCSF and RANKL as indicated for five minutes. Equal amounts of total protein were analyzed by western blotting for the indicated phospho- or total proteins. These data are representative of two separate experiments. Each experiment contained marrow cells pooled from three mice. F. Expression of cathepsin K mRNA following restoration of TIEG1 expression. Cells were infected as in A and RNA was harvested. Samples were analyzed by Real Time PCR for cathepsin K. Data depict mean +/− SD and were obtained from three replicate wells (p<0.05) and are representative of three separate experiments. G. Expression of cathepsin K protein following restoration of TIEG1 expression. Cells were infected as in A and protein harvested 6 hours after feeding on day 3 and analyzed for cathepsin K expression levels by western blotting. These data are representative of two separate experiments. Each experiment contained marrow cells pooled from three mice.
Figure 5
Figure 5. Blockade of TIEG1 expression in WT cells mimics TIEG1−/− cell responses.
Osteoclast precursors were transfected with accell-siNon-targetting (siNT) or accell-siTIEG1 as detailed in the Methods section. A. Wildtype osteoclast precursors were transfected at day 2 and TIEG1 expression was monitored by Real Time PCR on day 3. In the upper panel, green fluorescence demonstrates the transfection efficiency of accell-siNT and siTIEG1. The lower panel demonstrates the inhibition of TIEG1 expression by accell-siTIEG1 (mean +/− SD). These data were obtained from three replicate wells (p<0.05) and are representative of two separate experiments. Each experiment contained marrow cells pooled from three mice and analyzed in three replicate wells. B. siNT and siTIEG1 effects on osteoclast differentiation. WT osteoclast precursors were transfected with accell-siNT and siTIEG1 as in A and fixed and TRAP-stained on day 4. The upper panel is the quantitation of osteoclast number. The lower panel is a representative micrograph of TRAP-stained cultures. Data are presented as the mean +/− SD (p<0.05) and are representative of two separate experiments. Each experiment contained marrow cells pooled from three mice and analyzed in three replicate wells. C. siNT and siTIEG1 effects on NFATc1 phosphorylation. WT osteoclast precursors were treated as in A. Day 3 osteoclast precursors were serum-starved and either treated with MCSF or RANKL for five minutes. Equal amounts of total protein were analyzed by western blotting for phospho- or total NFATc1. D. siNT and siTIEG1 effects on cathepsin K expression. WT osteoclast precursors were treated as in A. Day 3 osteoclast precursor cell lystaes were harvested and equal amounts of total protein were analyzed by western blotting for cathepsin K expression. These data are representative of two separate experiments. Each experiment contained marrow cells pooled from three mice.
Figure 6
Figure 6. Effects of loss of TIEG1 expression on genes involved in osteoclast differentiation.
Osteoclast precursors from WT and TIEG1−/− (KO) mouse marrow were cultured as in Figure 1 for the indicated number of hours (h). Real Time PCR analysis of osteoclast differentiation marker genes, PU-1, RANK, c-fos, and OCIL was conducted at the indicated times. These data are presented as the mean +/− SD (p<0.05) and were obtained from four replicate wells. Data are representative of three separate experiments.
Figure 7
Figure 7. Effects of loss of TIEG1 expression on Bcl2 expression.
A. TIEG1−/− mouse marrow cells were cultured in the presence of MCSF and RANKL and infected at day 2 with vector or TIEG1 adenovirus. Bcl2 expression was monitor by real time PCR at day 3. These data were obtained from three replicate wells and are presented as the mean +/− SD (p<0.05). Data are representative of two separate experiments. Each experiment contained marrow cells pooled from three mice and analyzed in three replicate wells. B. Osteoclast precursors were cultured and infected at day 2 as in A. Day 3 osteoclast precursors were harvested and equal amounts of total protein were analyzed by western blotting for Bcl2 protein. These data are representative of two separate experiments. Each experiment contained marrow cells pooled from three mice.
Figure 8
Figure 8. Proposed model for TIEG1 effects on osteoclast differentiation and survival.
A. In osteoclast precursors, TIEG1 expression transiently increases expression of pro-differentiation PU.1, leading to increased RANK expression, which induces c-Fos expression. This, combined with suppression of the inhibitory osteoclast inhibitory lectin (OCIL) gene, increases NFATc1 expression to enhance osteoclast differentiation. B. Once osteoclasts mature, TIEG1 expression reduces MEK/ERK and AKT/NFκB activation and decreases Bcl2 protein levels, leading to osteoclast apoptosis.

Similar articles

Cited by

References

    1. Jimi E, Aoki K, Saito H, D'Acquisto F, May MJ, et al. Selective inhibition of NF-kappa B blocks osteoclastogenesis and prevents inflammatory bone destruction in vivo. Nat Med. 2004;10:617–624. - PubMed
    1. Michigami T, Ihara-Watanabe M, Yamazaki M, Ozono K. Receptor activator of nuclear factor kappaB ligand (RANKL) is a key molecule of osteoclast formation for bone metastasis in a newly developed model of human neuroblastoma. Cancer Res. 2001;61:1637–1644. - PubMed
    1. Mansky KC, Sankar U, Han J, Ostrowski MC. Microphthalmia transcription factor is a target of the p38 MAPK pathway in response to receptor activator of NF-kappa B ligand signaling. J Biol Chem. 2002;277:11077–11083. - PubMed
    1. Ikeda F, Matsubara T, Tsurukai T, Hata K, Nishimura R, et al. JNK/c-Jun signaling mediates an anti-apoptotic effect of RANKL in osteoclasts. J Bone Miner Res. 2008;23:907–914. - PubMed
    1. Gingery A, Bradley E, Shaw A, Oursler MJ. Phosphatidylinositol 3-kinase coordinately activates the MEK/ERK and AKT/NFkappaB pathways to maintain osteoclast survival. J Cell Biochem. 2003;89:165–179. - PubMed

Publication types

MeSH terms

Substances