

Nuclear scaffold attachment sites within ENCODE regions associate with actively transcribed genes
- PMID: 21423757
- PMCID: PMC3056778
- DOI: 10.1371/journal.pone.0017912
Nuclear scaffold attachment sites within ENCODE regions associate with actively transcribed genes
Abstract
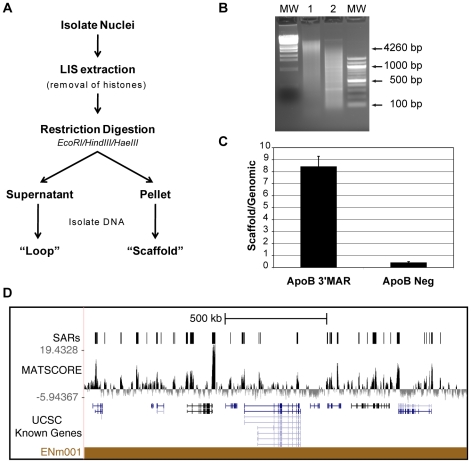
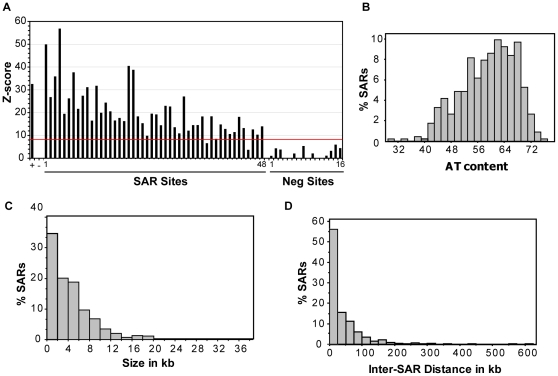
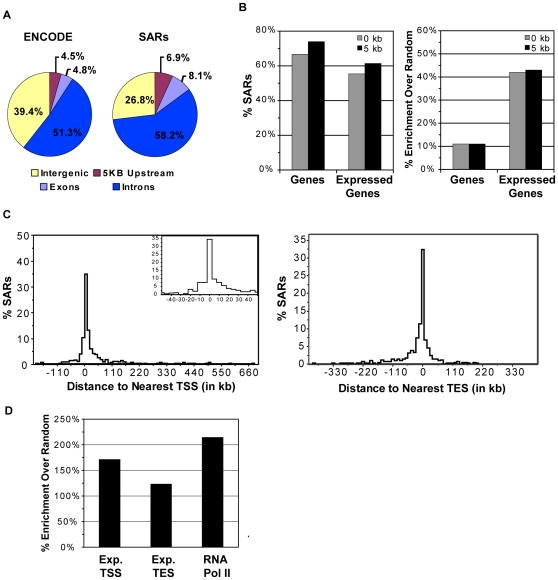
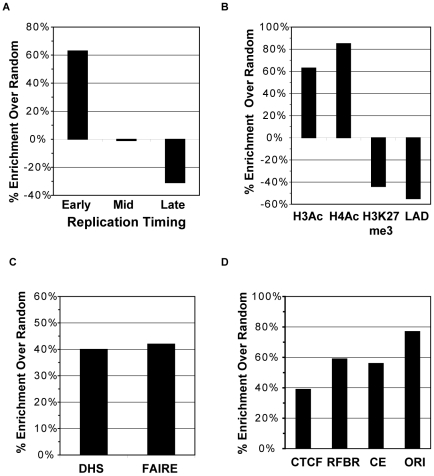
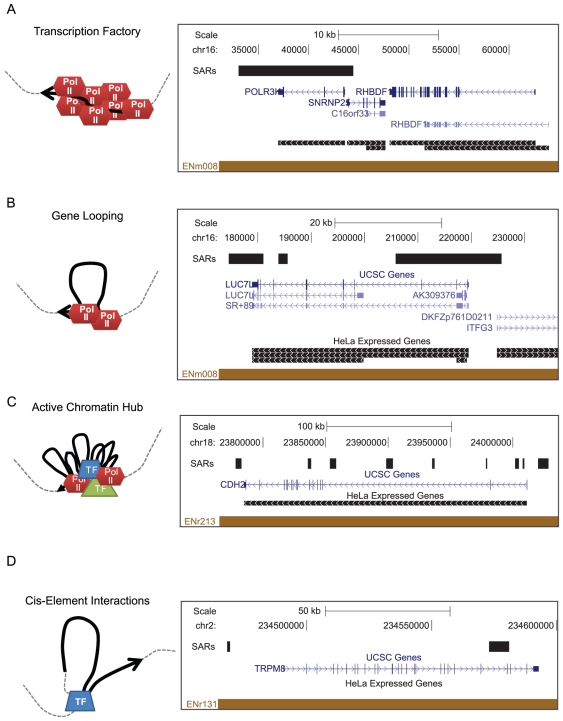
The human genome must be packaged and organized in a functional manner for the regulation of DNA replication and transcription. The nuclear scaffold/matrix, consisting of structural and functional nuclear proteins, remains after extraction of nuclei and anchors loops of DNA. In the search for cis-elements functioning as chromatin domain boundaries, we identified 453 nuclear scaffold attachment sites purified by lithium-3,5-iodosalicylate extraction of HeLa nuclei across 30 Mb of the human genome studied by the ENCODE pilot project. The scaffold attachment sites mapped predominately near expressed genes and localized near transcription start sites and the ends of genes but not to boundary elements. In addition, these regions were enriched for RNA polymerase II and transcription factor binding sites and were located in early replicating regions of the genome. We believe these sites correspond to genome-interactions mediated by transcription factors and transcriptional machinery immobilized on a nuclear substructure.
Conflict of interest statement
Figures
Similar articles
-
Differential nuclear scaffold/matrix attachment marks expressed genes.Hum Mol Genet. 2009 Feb 15;18(4):645-54. doi: 10.1093/hmg/ddn394. Epub 2008 Nov 18. Hum Mol Genet. 2009. PMID: 19017725 Free PMC article.
-
An unusual extended DNA loop attachment region is located in the human dystrophin gene.J Cell Physiol. 2006 Nov;209(2):515-21. doi: 10.1002/jcp.20759. J Cell Physiol. 2006. PMID: 16883579
-
Multiple collagen I gene regulatory elements have sites of stress-induced DNA duplex destabilization and nuclear scaffold/matrix association potential.J Cell Biochem. 2002;84(3):484-96. J Cell Biochem. 2002. PMID: 11813254
-
Scaffold/Matrix Attachment Regions and intrinsic DNA curvature.Biochemistry (Mosc). 2006 May;71(5):481-8. doi: 10.1134/s0006297906050038. Biochemistry (Mosc). 2006. PMID: 16732725 Review.
-
Chromatin domains and nuclear compartments: establishing sites of gene expression in eukaryotic nuclei.Mol Biol Rep. 1997 Aug;24(3):209-20. doi: 10.1023/a:1006873614521. Mol Biol Rep. 1997. PMID: 9291094 Review.
Cited by
-
The IS2 Element Improves Transcription Efficiency of Integration-Deficient Lentiviral Vector Episomes.Mol Ther Nucleic Acids. 2018 Dec 7;13:16-28. doi: 10.1016/j.omtn.2018.08.007. Epub 2018 Aug 18. Mol Ther Nucleic Acids. 2018. PMID: 30227274 Free PMC article.
-
Morphological, Biochemical, and Functional Study of Viral Replication Compartments Isolated from Adenovirus-Infected Cells.J Virol. 2016 Jan 13;90(7):3411-27. doi: 10.1128/JVI.00033-16. J Virol. 2016. PMID: 26764008 Free PMC article.
-
SATB2 drives glioblastoma growth by recruiting CBP to promote FOXM1 expression in glioma stem cells.EMBO Mol Med. 2020 Dec 7;12(12):e12291. doi: 10.15252/emmm.202012291. Epub 2020 Oct 30. EMBO Mol Med. 2020. PMID: 33124191 Free PMC article.
-
Chromosome territories and the global regulation of the genome.Genes Chromosomes Cancer. 2019 Jul;58(7):407-426. doi: 10.1002/gcc.22732. Epub 2019 Mar 18. Genes Chromosomes Cancer. 2019. PMID: 30664301 Free PMC article. Review.
-
Epigenetic landscape for initiation of DNA replication.Chromosoma. 2014 Jun;123(3):183-99. doi: 10.1007/s00412-013-0448-3. Epub 2013 Dec 17. Chromosoma. 2014. PMID: 24337246 Review.
References
-
- Cremer T, Cremer C. Chromosome territories, nuclear architecture and gene regulation in mammalian cells. Nat Rev Genet. 2001;2:292–301. - PubMed
-
- Bode J, Goetze S, Heng H, Krawetz SA, Benham C. From DNA structure to gene expression: mediators of nuclear compartmentalization and dynamics. Chromosome Res. 2003;11:435–445. - PubMed
Publication types
MeSH terms
Substances
Grants and funding
LinkOut - more resources
Full Text Sources
Molecular Biology Databases
Miscellaneous
