. 2011 Mar 14;6(3):e17865.
doi: 10.1371/journal.pone.0017865.

Genetic characteristics, coreceptor usage potential and evolution of Nigerian HIV-1 subtype G and CRF02_AG isolates

Affiliations

Genetic characteristics, coreceptor usage potential and evolution of Nigerian HIV-1 subtype G and CRF02_AG isolates

Hannah O Ajoge et al. PLoS One. .

Abstract

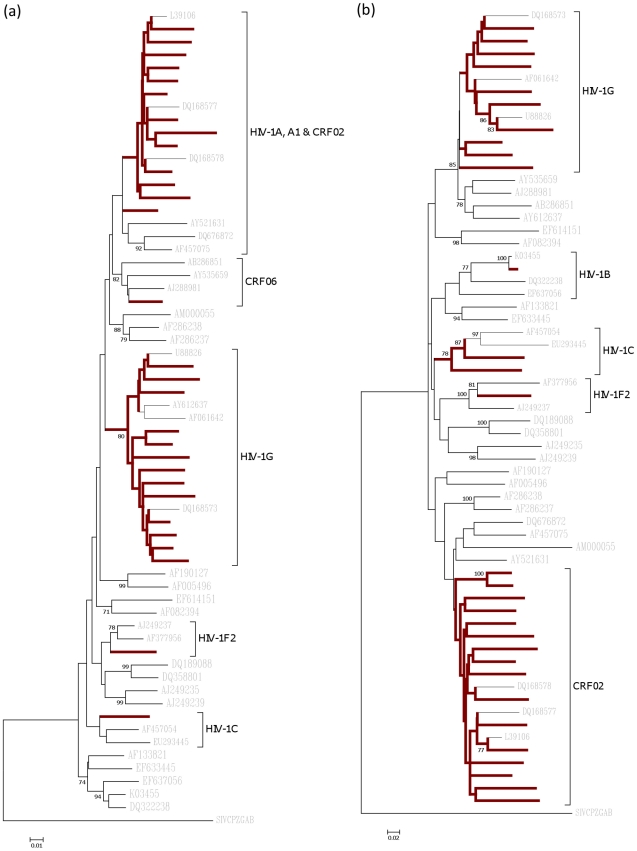
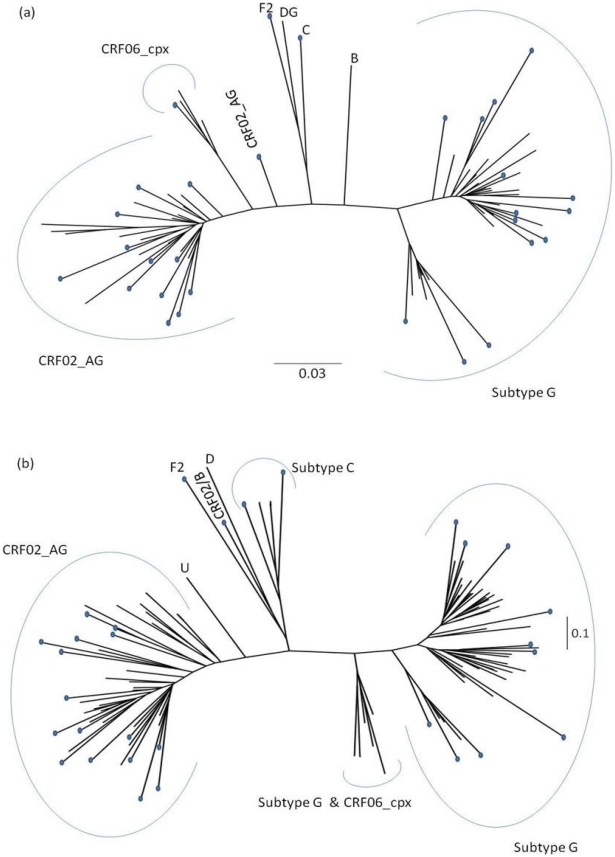
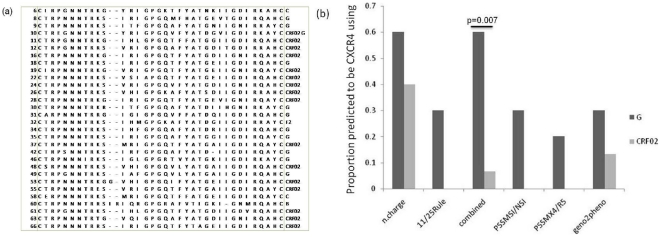
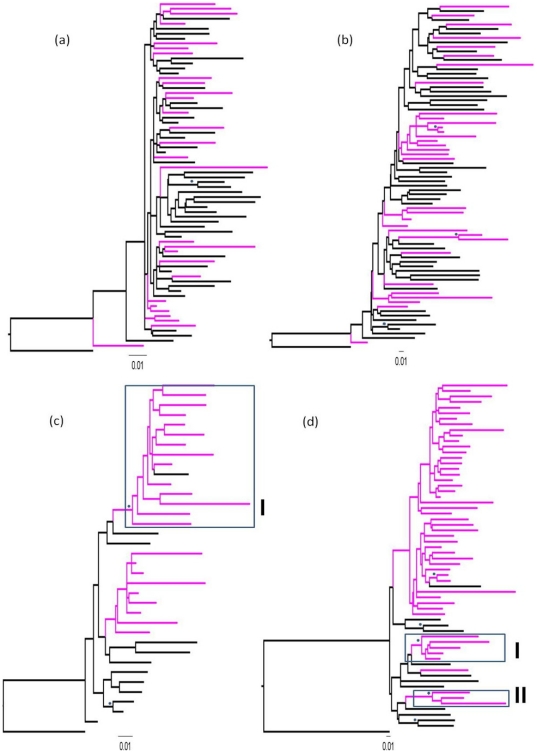
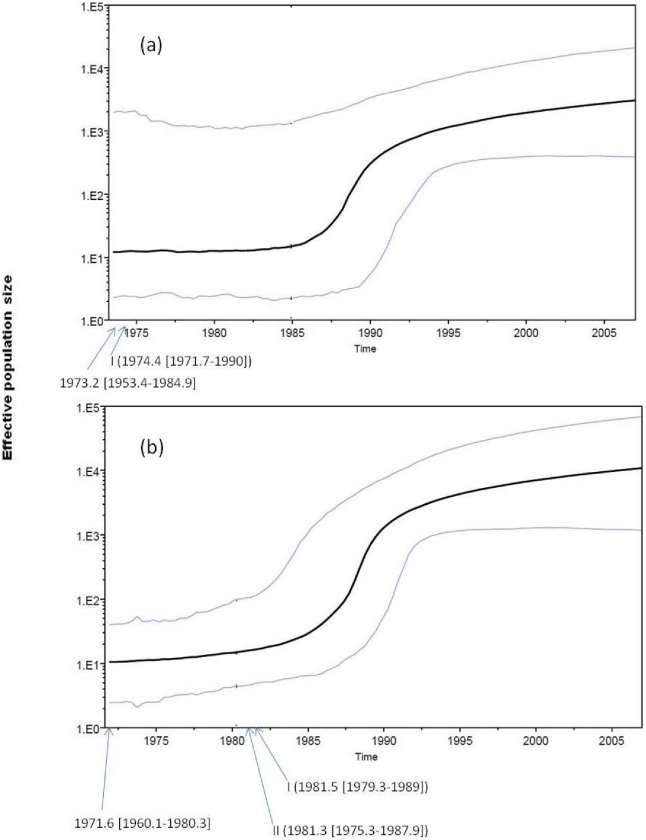
HIV-1 CRF02_AG and subtype G (HIV-1G) account for most HIV infections in Nigeria, but their evolutionary trends have not been well documented. To better elucidate the dynamics of the epidemic in Nigeria we characterised the gag and env genes of North-Central Nigerian HIV-1 isolates from pregnant women. Of 28 samples sequenced in both genes, the predominant clades were CRF02_AG (39%) and HIV-1G (32%). Higher predicted proportion of CXCR4-tropic (X4) HIV-1G isolates was noted compared to CRF02_AG (p = 0.007, Fisher's exact test). Phylogenetic and Bayesian analysis conducted on our sequences and all the dated available Nigerian sequences on the Los Alamos data base showed that CRF02_AG and HIV-1G entered into Nigeria through multiple entries, with presence of HIV-1G dating back to early 1980s. This study underlines the genetic complexity of the HIV-1 epidemic in Nigeria, possible subtype-specific differences in co-receptor usage, and the evolutionary trends of the predominant HIV-1 strains in Nigeria, which may have implications for the design of biomedical interventions and better understanding of the epidemic.


Conflict of interest statement

Competing Interests: The authors have declared that no competing interests exist.

Figures

Figure 1
Figure 1. Neighbor-joining trees for (a) gag and (b) env sequences.
The 29 gag and 30 env sequences were each aligned with reference sequences from the Los Alamos HIV database. The percentage (only values >70%) of replicate trees in which the associated taxa clustered together in the bootstrap test (1000 replicates) are shown. The evolutionary distances were computed using the Maximum Composite Likelihood method in Molecular Evolutionary Genetics Analysis (MEGA) software version 4.0.2. Study sequences' branches are in bold.
Figure 2
Figure 2. Relationship of study isolates to previous Nigerian HIV-1 isolates.
Maximum likelihood trees of (a) gag and (b) env isolates (indicated with pebbles at tip) and previous Nigerian gag and env isolates (obtained from the Los Alamos HIV database), respectively, using the GTR model which was the ‘best fit’ for both data sets as determined by the FindModel tool of the Los Alamos HIV database.
Figure 3
Figure 3. Env V3 amino acid sequences and CXCR4 usage potential of isolates.
(a) Env V3 amino acid sequences; each sequence is flanked by its sample number on the left and the subtype on the right. (b) A chart of relative CXCR4 usage prediction based on net charge rule [n.charge], the 11/25 rule, the combined criteria from the 11/25 and net charge rules [combined] as described by Raymond et al (2009), the web-based specific position-specific scoring matrixes (PSSM) programme and the web-based Geno2pheno tool.
Figure 4
Figure 4. Relationship between Nigerian isolates and reference sequences from other parts of the World.
Maximum likelihood analysis of (a) CFR02_AG gag, (b) CFR02_AG env, (c) HIV-1G gag and (d) HIV-1G env sequences. Each tree shows the relationship between Nigerian sequences (purple) and reference sequences from other countries (black), using the GTR best model as determined by FindModel tool of the Los Alamos HIV database. Trees were rooted using HIV-1B (HXB2) as outgroup. Bootstrap resamplings (1000 replicas) was used to assess robustness and values ≥70 are indicated with asterisk.
Figure 5
Figure 5. Bayesian skyline plots of Nigerian HIV-1G.
Past population dynamics of HIV-1G [based on (a) gag and (b) env data sets] infections reconstructed by Bayesian skyline plot. The first arrow from the left indicates the time of the MRCA. The other arrows indicate the estimated origin of the corresponding Nigerian clade (indicated by the Roman numeral) in the trees in Figure 4 c and d. HPDs (95%) are given in parenthesis beside each estimate.

Similar articles

Cited by

References

    1. Klimas N, Koneru AO, Fletcher MA. Overview of HIV. Psychosom Med. 2008;70:523–530. - PubMed
    1. Taylor BS, Sobieszczyk ME, McCutchan FE, Hammer SM. The Challenge of HIV-1 Subtype Diversity. N Engl J Med. 2008;358:1590–1602. - PMC - PubMed
    1. Lynch RM, Shen T, Gnanakaran S, Derdeyn CA. Appreciating HIV Type 1 Diversity: Subtype Differences in Env. AIDS Res Hum Retroviruses. 2009;25:237–248. - PMC - PubMed
    1. McBurney SP, Ross TM. Viral sequence diversity: challenges for AIDS vaccine designs. Expert Rev Vaccines. 2008;7:1405–1417. - PMC - PubMed
    1. Kilmarx PH. Global epidemiology of HIV. Curr Opin HIV AIDS. 2009;4:240–246. - PubMed

Publication types

MeSH terms

Substances

Associated data