. 2011 Nov;31(3):533-45.
doi: 10.1007/s10827-011-0316-1. Epub 2011 Mar 22.

Fast extraction of neuron morphologies from large-scale SBFSEM image stacks

Affiliations

Fast extraction of neuron morphologies from large-scale SBFSEM image stacks

Stefan Lang et al. J Comput Neurosci. 2011 Nov.

Abstract

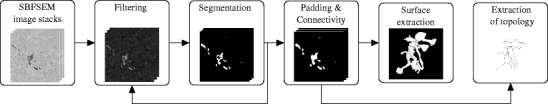
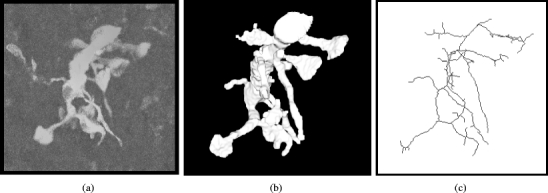
Neuron morphology is frequently used to classify cell-types in the mammalian cortex. Apart from the shape of the soma and the axonal projections, morphological classification is largely defined by the dendrites of a neuron and their subcellular compartments, referred to as dendritic spines. The dimensions of a neuron's dendritic compartment, including its spines, is also a major determinant of the passive and active electrical excitability of dendrites. Furthermore, the dimensions of dendritic branches and spines change during postnatal development and, possibly, following some types of neuronal activity patterns, changes depending on the activity of a neuron. Due to their small size, accurate quantitation of spine number and structure is difficult to achieve (Larkman, J Comp Neurol 306:332, 1991). Here we follow an analysis approach using high-resolution EM techniques. Serial block-face scanning electron microscopy (SBFSEM) enables automated imaging of large specimen volumes at high resolution. The large data sets generated by this technique make manual reconstruction of neuronal structure laborious. Here we present NeuroStruct, a reconstruction environment developed for fast and automated analysis of large SBFSEM data sets containing individual stained neurons using optimized algorithms for CPU and GPU hardware. NeuroStruct is based on 3D operators and integrates image information from image stacks of individual neurons filled with biocytin and stained with osmium tetroxide. The focus of the presented work is the reconstruction of dendritic branches with detailed representation of spines. NeuroStruct delivers both a 3D surface model of the reconstructed structures and a 1D geometrical model corresponding to the skeleton of the reconstructed structures. Both representations are a prerequisite for analysis of morphological characteristics and simulation signalling within a neuron that capture the influence of spines.


Figures

Fig. 1
Fig. 1
SBFSEM images of rat barrel cortex. Image of dendritic structures with spines (a), (b) zoomed view of the dendrite in (a), (c) image of a dendrite (red arrows) and a blood vessel touching it (blue arrow)
Fig. 2
Fig. 2
SBFSEM image properties. (a) image background signal along the red line in Fig. 1; (b) histogram of subfigure (A) in Fig. 1 where pixels marked by the red circle or with lower intensities correspond to the highlighted neural structures; (c) signal along the blue line with peaks of dark values indicating neural structures; (d) signal along the green line, arrow marks a spine neck with decreasing contrast
Fig. 3
Fig. 3
NeuroStruct’s workflow for the extraction of neural structures from SBFSEM image data
Fig. 4
Fig. 4
Neighborhood types as described in Jähne (2005) and Lee et al. (1994)
Fig. 5
Fig. 5
Filtering steps in the reconstruction workflow. A 300 × 300 pixel extract of an image of rat barrel cortex (a), inverted image (b), image after Top-Hat filtering with a rectangular structuring element b of size 41 × 41 pixel (c). Subtraction of image background through Top-Hat (d)
Fig. 6
Fig. 6
Segmentation result for a = b = 15, c = 3, δ = 15, γ = 0.25 and ϵ = 15 (a). M is calculated in the 15 × 15 × 3 neighborhood. Padding result after hole filling and smoothing of segmented data (b)
Fig. 7
Fig. 7
Surface reconstruction for a dendritic spine with Marching Cubes and Marching Cubes 33
Fig. 8
Fig. 8
A L4 spiny dendrite from a 300 × 300 × 60 SBFSEM image volume of rat barrel cortex: projection of experimental data (a) and its corresponding reconstructed 3D smoothed surface model (b). The one-dimensional skeleton approximation of the dendritic surface is shown in (c)
Fig. 9
Fig. 9
Surface reconstruction of a spiny L4 cell from Dataset II: (a) soma with dendrites. (b) details of the dendritic branch complex and spines in direct comparison with (d) a projection of the experimental data. (c) zoom of a spiny dendrite section. The area shown corresponds to the region that is marked green in (b). White length bars are 10 μm in (a), 1 μm otherwise
Fig. 10
Fig. 10
Surface reconstruction of a apical dendrite with spines from a L5 cell represented by Dataset III. Left and right pictures show two snapshots of areas with attached spines selected from the center picture. Length bars indicate 1 μm. Center picture shows an overview of the dendrite surface that corresponds to an extract of Dataset III. Length bar indicates 10 μm
Fig. 11
Fig. 11
Comparison of several aspects regarding reconstruction accuracy and completeness: (a) manually traced image and (b) original image data after inversion. (c) zoomed MIP plot of Dataset II with original EM resolution. (d) automatically traced image corresponding to (a) and (b). (e) unsmoothed manual reconstruction of Dataset I. (f) reconstruction extract from Dataset II that corresponds to (c)

References

    1. Adams R, Bischof L. Seeded region growing. IEEE Transactions on Pattern Analysis and Machine Intelligence. 1994;16(6):641–647. doi: 10.1109/34.295913. - DOI
    1. Al-Kofahi KA, Lasek S, Szarowski DH, Pace CJ, Nagy G, Turner JN, et al. Rapid automated three-dimensional tracing of neurons from confocal image stacks. IEEE Transactions on Information Technology in Biomedicine. 2002;6(2):171–187. doi: 10.1109/TITB.2002.1006304. - DOI - PubMed
    1. Broser PJ, Schulte R, Lang S, Roth A, Helmchen F, Waters DJ, et al. Nonlinear anisotropic diffusion filtering of three-dimensional image data from two-photon microscopy. Journal of Biomedical Optics. 2004;9(6):1253–1264. doi: 10.1117/1.1806832. - DOI - PubMed
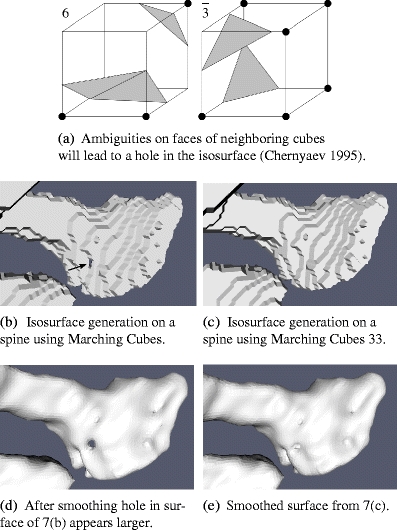
    1. Chernyaev, E. V. (1995). Marching cubes 33: Construction of topologically correct isosurfaces. Tech. rep., CERN CN 95-17.
    1. Cornea ND, Silver D, Min P. Curve-skeleton properties, applications, and algorithms. IEEE Transactions on Visualization and Computer Graphics. 2007;13(3):530–548. doi: 10.1109/TVCG.2007.1002. - DOI - PubMed

Publication types

LinkOut - more resources