. 2011 Sep;164(1):192-208.
doi: 10.1111/j.1476-5381.2011.01359.x.

Generation and characterization of a humanized PPARδ mouse model

Affiliations

Generation and characterization of a humanized PPARδ mouse model

B Gross et al. Br J Pharmacol. 2011 Sep.

Abstract

Background and purpose: Humanized mice for the nuclear receptor peroxisome proliferator-activated receptor δ (PPARδ), termed PPARδ knock-in (PPARδ KI) mice, were generated for the investigation of functional differences between mouse and human PPARδ and as tools for early drug efficacy assessment.

Experimental approach: Human PPARδ function in lipid metabolism was assessed at baseline, after fasting or when challenged with the GW0742 compound in mice fed a chow diet or high-fat diet (HFD).

Key results: Analysis of PPARδ mRNA levels revealed a hypomorph expression of human PPARδ in liver, macrophages, small intestine and heart, but not in soleus and quadriceps muscles, white adipose tissue and skin. PPARδ KI mice displayed a small decrease of high-density lipoprotein-cholesterol whereas other lipid parameters were unaltered. Plasma metabolic parameters were similar in wild-type and PPARδ KI mice when fed chow or HFD, and following physiological (fasting) and pharmacological (GW0742 compound) activation of PPARδ. Gene expression profiling in liver, soleus muscle and macrophages showed similar gene patterns regulated by mouse and human PPARδ. The anti-inflammatory potential of human PPARδ was also similar to mouse PPARδ in liver and isolated macrophages.

Conclusions and implications: These data indicate that human PPARδ can compensate for mouse PPARδ in the regulation of lipid metabolism and inflammation. Overall, this novel PPARδ KI mouse model shows full responsiveness to pharmacological challenge and represents a useful tool for the preclinical assessment of PPARδ activators with species-specific activity.


Figures

Figure 1
Figure 1
Targeted replacement of the mouse PPARδ gene by the human orthologous cDNA. (A) Strategy for the development of the PPARδ KI mouse model. From top to bottom: wild-type locus of the mouse PPARδ gene with the coding sequence initiating in exon 3 and ending in exon 8, the targeting vector and the targeted locus. Expected DNA restriction fragments and their size are represented by double-headed arrows under the respective genomic structures. Restriction sites are: B, BamHI; H, HpaI; Hd, HindIII. Black boxes indicate exons, grey boxes the cDNA, arrow heads loxP sites, black arrow the thymidine kinase (TK) expression cassette, open arrow the neomycin (Neo) expression cassette. (B) Genomic Southern blot analysis of four targeted embryonic stem cell clones (recombinant ES clones) as opposed to wild-type cells (+/+). Southern blots show integration of the targeting vector with appropriate genomic alterations at 5′ and 3′ termini to the homologous recombination sites. When one allele of the mouse PPARδ gene is replaced by homologous recombination, BamHI and HpaI restriction fragments of 13.4 kb appeared when the gene was analysed with the 5′ probe and 3′ probe respectively. (C) Southern blot analysis of tail DNA from wild-type (+/+), heterozygous (+/KI) and homozygous (KI/KI) mutant mice carrying either the wild-type, one or both targeted alleles. Deduced genotypes are indicated on top. (D) RT-PCR with species-specific primers performed on liver samples from wild-type (+/+), heterozygous (+/KI) and homozygous (KI/KI) PPARδ KI mice. ES, embryonic stem; KI, knock-in.
Figure 2
Figure 2
Comparative expression analysis of the different PPAR isotypes in PPARδ KI and wild-type (WT) mouse tissues. Transcript levels of PPARδ, PPARα and PPARγ were measured in liver, skeletal muscle (soleus and quadriceps), white adipose tissue (WAT), peritoneal macrophages, small intestine, heart and skin. Relative expression of PPAR transcripts in WT and PPARδ KI mice was measured by quantitative PCR. Expression values are normalized to 36B4 and expression of PPARδ, PPARα and PPARγ in WT mice was set at 100 for each tissue. Values represent means ± SD. Significant differences by Student's t-test. *P < 0.05; **P < 0.005; ***P < 0.001 WT versus PPARδ KI. KI, knock-in.
Figure 3
Figure 3
Expression of hPPARδ did not alter the metabolic response to fasting. (A) Plasma metabolites were analysed in fed, 24 h fasted wild-type and PPARδ KI mice. (B) Expression of genes involved in carbohydrate, lipid and lipoprotein metabolism were measured by quantitative PCR in livers from fed and fasted wild-type and PPARδ KI mice. Expression values are normalized to cyclophilin and expression of fed wild-type mice was set at 100. Values represent means ± SD. Significant differences by one-way anova analysis. *P < 0.05; **P < 0.005; ***P < 0.001 fed versus fasted. KI, knock-in.
Figure 3
Figure 3
Expression of hPPARδ did not alter the metabolic response to fasting. (A) Plasma metabolites were analysed in fed, 24 h fasted wild-type and PPARδ KI mice. (B) Expression of genes involved in carbohydrate, lipid and lipoprotein metabolism were measured by quantitative PCR in livers from fed and fasted wild-type and PPARδ KI mice. Expression values are normalized to cyclophilin and expression of fed wild-type mice was set at 100. Values represent means ± SD. Significant differences by one-way anova analysis. *P < 0.05; **P < 0.005; ***P < 0.001 fed versus fasted. KI, knock-in.
Figure 4
Figure 4
Effect of GW0742 treatment on gene regulation in livers of wild-type (WT) and PPARδ KI mice. Liver mRNA expression levels from vehicle- and GW0742-treated WT and PPARδ KI mice were measured by quantitative PCR. Analysed transcript were classified according to their metabolic function: (A) lipoprotein and TG metabolism (B) fatty acid oxidation and transport. Expression values are normalized to cyclophilin and expression of vehicle-treated WT mice was set at 100. Values represent means ± SD. Significant differences by one-way anova analysis. *P < 0.05; **P < 0.005; ***P < 0.001 vehicle versus GW0742. #P < 0.05; ##P < 0.005 ###P < 0.001 WT versus PPARδ KI. KI, knock-in; TG, triglyceride.
Figure 4
Figure 4
Effect of GW0742 treatment on gene regulation in livers of wild-type (WT) and PPARδ KI mice. Liver mRNA expression levels from vehicle- and GW0742-treated WT and PPARδ KI mice were measured by quantitative PCR. Analysed transcript were classified according to their metabolic function: (A) lipoprotein and TG metabolism (B) fatty acid oxidation and transport. Expression values are normalized to cyclophilin and expression of vehicle-treated WT mice was set at 100. Values represent means ± SD. Significant differences by one-way anova analysis. *P < 0.05; **P < 0.005; ***P < 0.001 vehicle versus GW0742. #P < 0.05; ##P < 0.005 ###P < 0.001 WT versus PPARδ KI. KI, knock-in; TG, triglyceride.
Figure 5
Figure 5
Effect of GW0742 treatment on gene regulation in soleus muscle of wild-type and PPARδ KI mice. mRNA expression levels of vehicle- and GW0742-treated wild-type and PPARδ KI mice were measured by quantitative PCR. Expression values are normalized to 36B4 and expression of vehicle-treated wild-type mice was set at 100. Values represent means ± SD. Significant differences by one-way anova analysis. *P < 0.05; **P < 0.005; ***P < 0.001 vehicle versus GW0742. KI, knock-in.
Figure 6
Figure 6
Similar response of hPPARδ KI and wild-type (WT) mice upon being fed a high-fat diet. (A) Plasma lipids were analysed in WT and PPARδ KI mice fed high-fat diet for 7 weeks followed by 14 days treatment with vehicle or GW0742 at 20 mg·kg−1·day−1. (B, C) Hepatic expression of genes involved in lipid metabolism and in the inflammatory response were analysed in vehicle- and GW0742-treated WT and PPARδ KI mice by quantitative PCR. Expression values are normalized to 36B4 and expression of vehicle-treated WT mice was set at 100. Values represent means ± SD. Significant differences by one-way anova analysis. *P < 0.05; **P < 0.005; ***P < 0.001 vehicle versus GW0742. #P < 0.05; ##P < 0.005 ###P < 0.001 WT versus PPARδ KI. KI, knock-in.
Figure 6
Figure 6
Similar response of hPPARδ KI and wild-type (WT) mice upon being fed a high-fat diet. (A) Plasma lipids were analysed in WT and PPARδ KI mice fed high-fat diet for 7 weeks followed by 14 days treatment with vehicle or GW0742 at 20 mg·kg−1·day−1. (B, C) Hepatic expression of genes involved in lipid metabolism and in the inflammatory response were analysed in vehicle- and GW0742-treated WT and PPARδ KI mice by quantitative PCR. Expression values are normalized to 36B4 and expression of vehicle-treated WT mice was set at 100. Values represent means ± SD. Significant differences by one-way anova analysis. *P < 0.05; **P < 0.005; ***P < 0.001 vehicle versus GW0742. #P < 0.05; ##P < 0.005 ###P < 0.001 WT versus PPARδ KI. KI, knock-in.
Figure 7
Figure 7
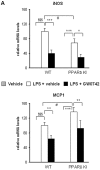
Effect of GW0742 treatment on gene regulation in peritoneal macrophages of wild-type (WT) and PPARδ KI mice. (A) Expression of genes involved in the inflammatory response was analysed by quantitative PCR in peritoneal macrophages from WT and PPARδ KI mice. Macrophages were treated with vehicle or LPS (100 ng·mL−1) for 24 h in presence of vehicle or GW0742 (100 nM). Expression values are normalized to cyclophilin and expression of LPS + vehicle-treated WT macrophages was set at 100. Values represent means ± SD. Significant differences by one-way anova analysis. §§§P < 0.005 vehicle versus LPS + vehicle; *P < 0.05; **P < 0.005; ***P < 0.001 LPS + vehicle versus LPS + GW0742. #P < 0.05 WT versus PPARδ KI. (B) Expression of genes involved in lipid homeostasis were analysed by quantitative PCR in peritoneal macrophages from WT and PPARδ KI mice treated with vehicle or GW0742 (100 nM) for 24 h. Expression values are normalized to cyclophilin and expression of vehicle-treated WT mice was set at 100. Values represent means ± SD. Significant differences by one-way anova analysis. *P < 0.05; **P < 0.005; ***P < 0.001 vehicle versus GW0742. #P < 0.05; ##P < 0.005 ###P < 0.001 WT versus PPARδ KI. KI, knock-in.
Figure 7
Figure 7
Effect of GW0742 treatment on gene regulation in peritoneal macrophages of wild-type (WT) and PPARδ KI mice. (A) Expression of genes involved in the inflammatory response was analysed by quantitative PCR in peritoneal macrophages from WT and PPARδ KI mice. Macrophages were treated with vehicle or LPS (100 ng·mL−1) for 24 h in presence of vehicle or GW0742 (100 nM). Expression values are normalized to cyclophilin and expression of LPS + vehicle-treated WT macrophages was set at 100. Values represent means ± SD. Significant differences by one-way anova analysis. §§§P < 0.005 vehicle versus LPS + vehicle; *P < 0.05; **P < 0.005; ***P < 0.001 LPS + vehicle versus LPS + GW0742. #P < 0.05 WT versus PPARδ KI. (B) Expression of genes involved in lipid homeostasis were analysed by quantitative PCR in peritoneal macrophages from WT and PPARδ KI mice treated with vehicle or GW0742 (100 nM) for 24 h. Expression values are normalized to cyclophilin and expression of vehicle-treated WT mice was set at 100. Values represent means ± SD. Significant differences by one-way anova analysis. *P < 0.05; **P < 0.005; ***P < 0.001 vehicle versus GW0742. #P < 0.05; ##P < 0.005 ###P < 0.001 WT versus PPARδ KI. KI, knock-in.

Similar articles

Cited by

References

    1. Barak Y, Liao D, He W, Ong ES, Nelson MC, Olefsky JM, et al. Effects of peroxisome proliferator-activated receptor δ on placentation, adiposity, and colorectal cancer. Proc Natl Acad Sci USA. 2002;99:303–308. - PMC - PubMed
    1. Barish GD, Narkar VA, Evans RM. PPARδ: a dagger in the heart of the metabolic syndrome. J Clin Invest. 2006;116:590–597. - PMC - PubMed
    1. Briand F, Naik SU, Fuki I, Millar JS, Macphee C, Walker M, et al. Both the peroxisome proliferator-activated receptor (PPAR) delta agonist, GW0742, and ezetimibe promote reverse cholesterol transport in mice by reducing intestinal re-absorption of HDL-derived cholesterol. Clin Transl Sci. 2009;2:127–133. - PMC - PubMed
    1. Bugge A, Grøntved L, Aagaard MM, Borup R, Mandrup S. The PPARgamma2 A/B-domain plays a gene-specific role in transactivation and cofactor recruitment. Mol Endocrinol. 2009;23:794–808. - PMC - PubMed
    1. Chawla A, Lee CH, Barak Y, He W, Rosenfeld J, Liao D, et al. PPARδ is a very low-density lipoprotein sensor in macrophages. Proc Natl Acad Sci USA. 2003;100:1268–1273. - PMC - PubMed

Publication types

MeSH terms

Substances