

A genome-wide view of mutation rate co-variation using multivariate analyses
- PMID: 21426544
- PMCID: PMC3129677
- DOI: 10.1186/gb-2011-12-3-r27
A genome-wide view of mutation rate co-variation using multivariate analyses
Abstract
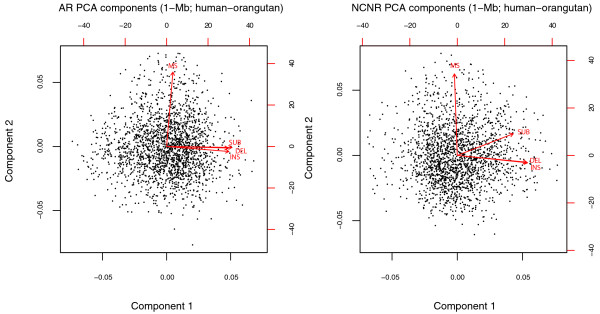
Background: While the abundance of available sequenced genomes has led to many studies of regional heterogeneity in mutation rates, the co-variation among rates of different mutation types remains largely unexplored, hindering a deeper understanding of mutagenesis and genome dynamics. Here, utilizing primate and rodent genomic alignments, we apply two multivariate analysis techniques (principal components and canonical correlations) to investigate the structure of rate co-variation for four mutation types and simultaneously explore the associations with multiple genomic features at different genomic scales and phylogenetic distances.
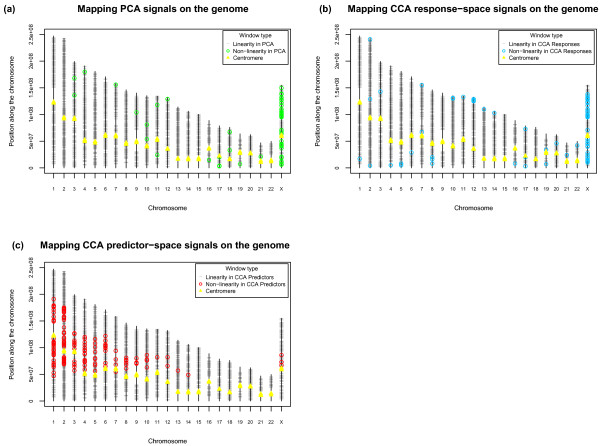
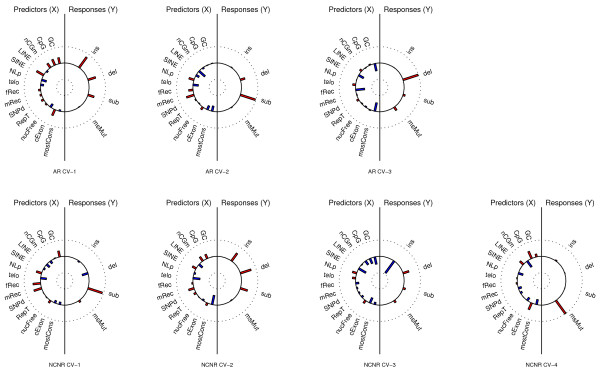
Results: We observe a consistent, largely linear co-variation among rates of nucleotide substitutions, small insertions and small deletions, with some non-linear associations detected among these rates on chromosome X and near autosomal telomeres. This co-variation appears to be shaped by a common set of genomic features, some previously investigated and some novel to this study (nuclear lamina binding sites, methylated non-CpG sites and nucleosome-free regions). Strong non-linear relationships are also detected among genomic features near the centromeres of large chromosomes. Microsatellite mutability co-varies with other mutation rates at finer scales, but not at 1 Mb, and shows varying degrees of association with genomic features at different scales.
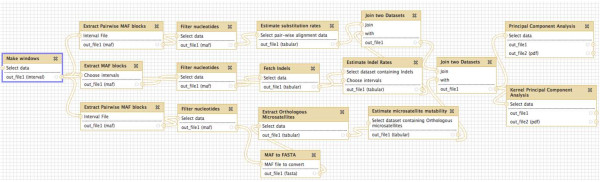
Conclusions: Our results allow us to speculate about the role of different molecular mechanisms, such as replication, recombination, repair and local chromatin environment, in mutagenesis. The software tools developed for our analyses are available through Galaxy, an open-source genomics portal, to facilitate the use of multivariate techniques in future large-scale genomics studies.
Figures
References
-
- Lercher MJ, Williams EJ, Hurst LD. Local similarity in evolutionary rates extends over whole chromosomes in human-rodent and mouse-rat comparisons: implications for understanding the mechanistic basis of the male mutation bias. Mol Biol Evol. 2001;18:2032–2039. - PubMed
-
- Hardison RC, Roskin KM, Yang S, Diekhans M, Kent WJ, Weber R, Elnitski L, Li J, O'Connor M, Kolbe D, Schwartz S, Furey TS, Whelan S, Goldman N, Smit A, Miller W, Chiaromonte F, Haussler D. Covariation in frequencies of substitution, deletion, transposition, and recombination during eutherian evolution. Genome Res. 2003;13:13–26. doi: 10.1101/gr.844103. - DOI - PMC - PubMed
Publication types
MeSH terms
Grants and funding
LinkOut - more resources
Full Text Sources
Miscellaneous
