

Coordination of cell proliferation and anterior-posterior axis establishment in the mouse embryo
- PMID: 21427142
- PMCID: PMC3062422
- DOI: 10.1242/dev.063537
Coordination of cell proliferation and anterior-posterior axis establishment in the mouse embryo
Abstract
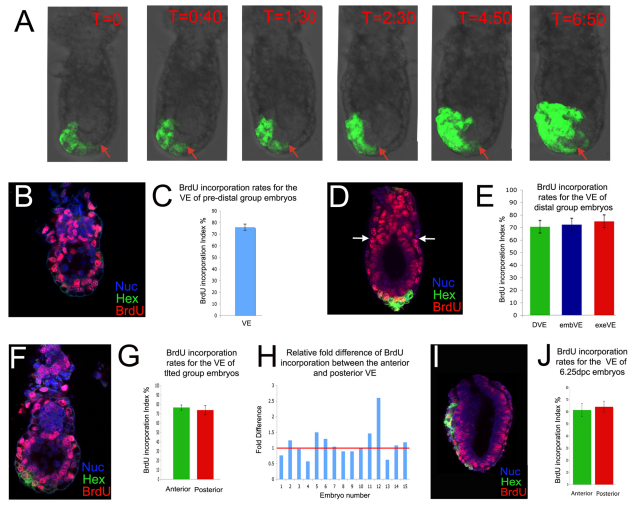
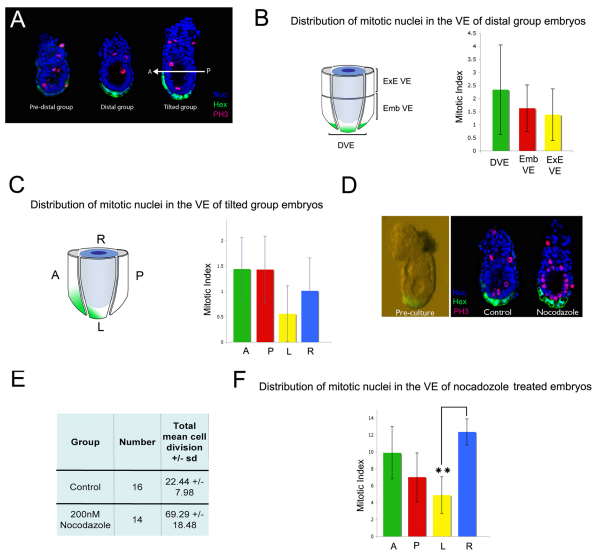
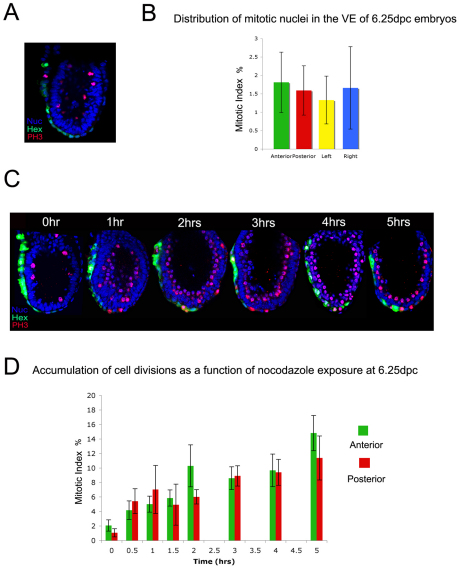
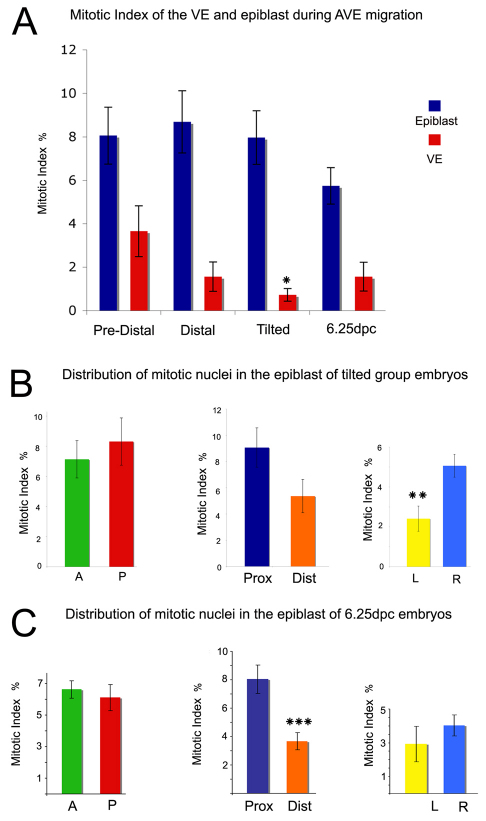
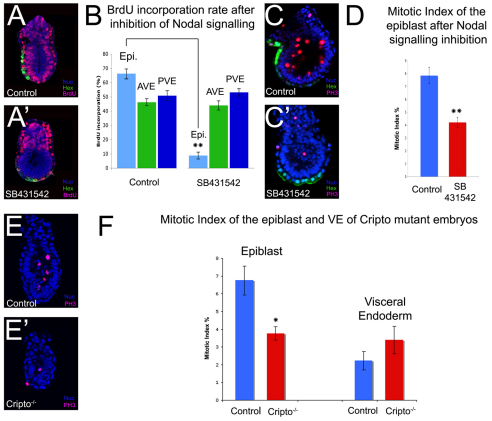
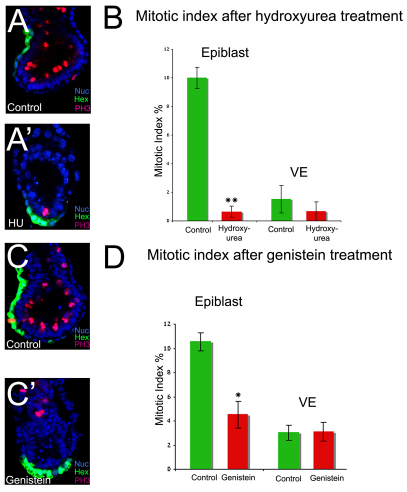
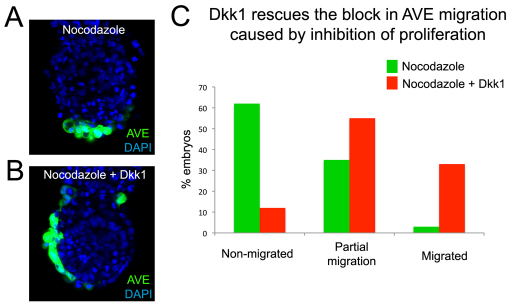
During development, the growth of the embryo must be coupled to its patterning to ensure correct and timely morphogenesis. In the mouse embryo, migration of the anterior visceral endoderm (AVE) to the prospective anterior establishes the anterior-posterior (A-P) axis. By analysing the distribution of cells in S phase, M phase and G2 from the time just prior to the migration of the AVE until 18 hours after its movement, we show that there is no evidence for differential proliferation along the A-P axis of the mouse embryo. Rather, we have identified that as AVE movements are being initiated, the epiblast proliferates at a much higher rate than the visceral endoderm. We show that these high levels of proliferation in the epiblast are dependent on Nodal signalling and are required for A-P establishment, as blocking cell division in the epiblast inhibits AVE migration. Interestingly, inhibition of migration by blocking proliferation can be rescued by Dkk1. This suggests that the high levels of epiblast proliferation function to move the prospective AVE away from signals that are inhibitory to its migration. The finding that initiation of AVE movements requires a certain level of proliferation in the epiblast provides a mechanism whereby A-P axis development is coordinated with embryonic growth.
Figures
Similar articles
-
Rac1-dependent collective cell migration is required for specification of the anterior-posterior body axis of the mouse.PLoS Biol. 2010 Aug 3;8(8):e1000442. doi: 10.1371/journal.pbio.1000442. PLoS Biol. 2010. PMID: 20689803 Free PMC article.
-
Nodal dependent differential localisation of dishevelled-2 demarcates regions of differing cell behaviour in the visceral endoderm.PLoS Biol. 2011 Feb;9(2):e1001019. doi: 10.1371/journal.pbio.1001019. Epub 2011 Feb 22. PLoS Biol. 2011. PMID: 21364967 Free PMC article.
-
Nodal signaling from the visceral endoderm is required to maintain Nodal gene expression in the epiblast and drive DVE/AVE migration.Dev Biol. 2015 Apr 1;400(1):1-9. doi: 10.1016/j.ydbio.2014.12.016. Epub 2014 Dec 20. Dev Biol. 2015. PMID: 25536399 Free PMC article.
-
The Head's Tale: Anterior-Posterior Axis Formation in the Mouse Embryo.Curr Top Dev Biol. 2018;128:365-390. doi: 10.1016/bs.ctdb.2017.11.003. Epub 2017 Dec 8. Curr Top Dev Biol. 2018. PMID: 29477169 Review.
-
Heading forwards: anterior visceral endoderm migration in patterning the mouse embryo.Philos Trans R Soc Lond B Biol Sci. 2014 Dec 5;369(1657):20130546. doi: 10.1098/rstb.2013.0546. Philos Trans R Soc Lond B Biol Sci. 2014. PMID: 25349454 Free PMC article. Review.
Cited by
-
Senescence-associated β-galactosidase activity marks the visceral endoderm of mouse embryos but is not indicative of senescence.Genesis. 2014 Apr;52(4):300-8. doi: 10.1002/dvg.22761. Epub 2014 Mar 28. Genesis. 2014. PMID: 24616249 Free PMC article.
-
The Dynamics of Morphogenesis in the Early Mouse Embryo.Cold Spring Harb Perspect Biol. 2014 Jun 26;7(11):a015867. doi: 10.1101/cshperspect.a015867. Cold Spring Harb Perspect Biol. 2014. PMID: 24968703 Free PMC article. Review.
-
Vertebrate Axial Patterning: From Egg to Asymmetry.Adv Exp Med Biol. 2017;953:209-306. doi: 10.1007/978-3-319-46095-6_6. Adv Exp Med Biol. 2017. PMID: 27975274 Free PMC article. Review.
-
Selecting for fitness in mammalian development.Cell Cycle. 2014;13(1):9-10. doi: 10.4161/cc.27026. Epub 2013 Dec 20. Cell Cycle. 2014. PMID: 24231769 Free PMC article. No abstract available.
-
On the enigmatic disappearance of Rauber's layer.Proc Natl Acad Sci U S A. 2020 Jul 14;117(28):16409-16417. doi: 10.1073/pnas.2002008117. Epub 2020 Jun 29. Proc Natl Acad Sci U S A. 2020. PMID: 32601185 Free PMC article.
References
-
- Ben-Haim N., Lu C., Guzman-Ayala M., Pescatore L., Mesnard D., Bischofberger M., Naef F., Robertson E. J., Constam D. B. (2006). The nodal precursor acting via activin receptors induces mesoderm by maintaining a source of its convertases and BMP4. Dev. Cell 11, 313-323 - PubMed
-
- Brennan J., Lu C. C., Norris D. P., Rodriguez T. A., Beddington R. S., Robertson E. J. (2001). Nodal signalling in the epiblast patterns the early mouse embryo. Nature 411, 965-969 - PubMed
-
- Camus A., Perea-Gomez A., Moreau A., Collignon J. (2006). Absence of nodal signaling promotes precocious neural differentiation in the mouse embryo. Dev. Biol. 295, 743-755 - PubMed
-
- Chenn A., Walsh C. A. (2002). Regulation of cerebral cortical size by control of cell cycle exit in neural precursors. Science 297, 365-369 - PubMed
-
- Connolly K. M., Bogdanffy M. S. (1993). Evaluation of proliferating cell nuclear antigen (PCNA) as an endogenous marker of cell proliferation in rat liver: a dual-stain comparison with 5-bromo-2′-deoxyuridine. J. Histochem. Cytochem. 41, 1-6 - PubMed
Publication types
MeSH terms
Grants and funding
LinkOut - more resources
Full Text Sources
Other Literature Sources
Molecular Biology Databases
