. 2011 Apr 20;30(8):1621-33.
doi: 10.1038/emboj.2011.74. Epub 2011 Mar 22.

Grb2 regulates B-cell maturation, B-cell memory responses and inhibits B-cell Ca2+ signalling

Affiliations

Grb2 regulates B-cell maturation, B-cell memory responses and inhibits B-cell Ca2+ signalling

Jochen A Ackermann et al. EMBO J. .

Abstract

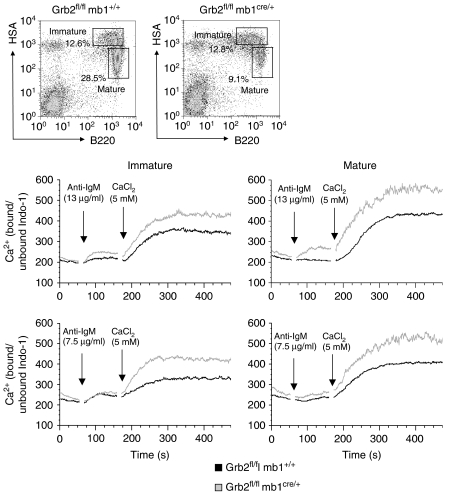
Grb2 is a ubiquitously expressed adaptor protein, which activates Ras and MAP kinases in growth factor receptor signalling, while in B-cell receptor (BCR) signalling this role is controversial. In B cell lines it was shown that Grb2 can inhibit BCR-induced Ca(2+) signalling. Nonetheless, the physiological role of Grb2 in primary B cells is still unknown. We generated a B-cell-specific Grb2-deficient mouse line, which had a severe reduction of mature follicular B cells in the periphery due to a differentiation block and decreased B-cell survival. Moreover, we found several changes in important signalling pathways: enhanced BCR-induced Ca(2+) signalling, alterations in mitogen-activated protein kinase activation patterns and strongly impaired Akt activation, the latter pointing towards a defect in PI3K signalling. Interestingly, B-cell-specific Grb2-deficient mice showed impaired IgG and B-cell memory responses, and impaired germinal centre formation. Thus, Grb2-dependent signalling pathways are crucial for lymphocyte differentiation processes, as well as for control of secondary humoral immune responses.


Conflict of interest statement

The authors declare that they have no conflict of interest.

Figures

Figure 1
Figure 1
Grb2fl/fl mb1cre/+ mice have decreased numbers of mature B cells in the bone marrow and decreased numbers of transitional and mature B cells in the periphery. (A) Bone marrow cells were stained according to the Hardy fractions A-F and with B220 versus IgM. Typical examples are shown. Bottom right, quantitative analysis of Hardy fractions A-F in absolute cell numbers. (B) Blood cells, (C) splenic cells or (D) peritoneal lavage cells are analysed by the indicated markers and total cell numbers are given for some populations in bar diagrams. *P<0.05; **P<0.01; ***P<0.001. Each experiment was done at least four times. T1, transitional type 1; T2, transitional type 2; MZ, marginal zone; M, mature; FO, follicular B cells.
Figure 2
Figure 2
Grb2−/− B cells have a competitive disadvantage to wild-type B cells in vivo. B-cell subsets (left) in the bone marrow (A) and spleen (B) of mixed bone marrow chimaeras, generated by injection of Grb2fl/fl mb1cre/+ (CD45.2) and wild-type (CD45.1) bone marrow cells (1:1 mixture) into RAG1−/− recipients, analysed 7–8 weeks after transfer. Gated populations were separately analysed for percentage of CD45.1+ cells in histograms (middle). Numbers in histograms indicate percent of CD45.1+ cells±s.d. Statistical analysis of percentages of CD45.1+ cells within several gated populations is given in addition in bar diagrams (right). Five recipient mice were analysed which all showed similar results. T, T cells; non-B, non-B cells; pre-B, pre-B cells; immat. B, immature B cells; mat. B, mature B cells; B1, B1 cells; B2, B2 cells; MZ B, marginal zone B cells; Foll. B, follicular B cells.
Figure 3
Figure 3
Grb2−/− B cells show a lower turnover rate, a reduced survival rate in vitro and impaired BAFF-R upregulation. (A) BrdU incorporation of splenic B cells in mice, which were fed for indicated time periods with BrdU in drinking water. BrdU+ cells are shown in line diagrams for indicated populations. One typical example of three independent experiments is shown. Statistics are summarized results of five mice each. (B) Mice were fed for 21 days with BrdU (pulse) followed by indicated time points without BrdU (chase). Statistical analysis could only be done for day 73, because only at this time point there were three mice per group. At all other time points there were two control and three Grb2−/− mice. (C) Spontaneous apoptosis rates of sorted immature and mature B cells (shown on top before sorting) in medium without cytokines for indicated time periods measured by intracellular DAPI stainings. Shown are summarized results of three independent experiments. (D) BAFF-R expression is shown for immature (HSAhiB220lo) or mature (HSAloB220hi) B cells and mean fluorescence intensities (mfi) quantified from five mice each. *P<0.05; **P<0.01; ***P<0.001, P-values are only shown for significant differences.
Figure 4
Figure 4
Enhanced Ca2+ signalling in B cells of Grb2fl/fl mb1cre/+ mice. Extracellular and intracellular calcium mobilization of Indo-1 loaded splenic B cells of Grb2fl/fl mb1cre/+ and control mice, stimulated with anti-IgM (Fab2) in Ca2+-free medium and then CaCl2 was added at indicated time point. Immature and mature B cells were analysed separately as indicated by HSA/B220 staining. Data represent typical results of four independent experiments.
Figure 5
Figure 5
Grb2−/− B cells show impaired Ras, JNK and AKT and CD22 signalling, but increased Syk activation. (AC) Splenic B cells of Grb2fl/fl mb1cre/+ and control mice were stimulated for indicated time points with anti-IgM (Fab2) antibodies. (A, C) Lysates were analysed by western blot with phospho-specific antibodies. CD22 phosphorylation was analysed after CD22 IP from sorted mature B cells, blotted with anti-phospotyrosine antibody (B) Active Ras was precipitated with Raf1-binding domain and blotted with anti-Ras antibody. (AC) One typical example of three experiments is shown. Diagrams below western blots show quantification of band intensities (phospho-specific bands divided by loading controls) in arbitrary units, summarized from at least three experiments each. *P<0.05; **P<0.01.
Figure 6
Figure 6
Grb2fl/fl mb1cre/+ mice show higher serum IgM levels and higher numbers of IgM-secreting plasma cells. (A) Serum Ig levels of Grb2fl/fl mb1cre/+ and control mice were measured by ELISA. (B) Antibody-secreting cell numbers were determined by ELISPOT. Data represent typical results of three analyzed mice per group. (C) Spleen sections stained with anti-IgM (green) and MOMA (red). IgM+ plasma cells are indicated by arrows. Original magnification, × 5. Data represent typical results of three analysed mice per group. **P<0.01; ***P<0.001.
Figure 7
Figure 7
Grb2fl/fl mb1cre/+ mice have impaired TI type 2 responses and impaired germinal centre formation. (A) Mice were immunized with TNP-ficoll and anti-TNP IgM and IgG3 responses were determined by ELISA. (B) (Left) Spleen sections stained with PNA (green), IgM (red) and IgD (blue), 10 days after immunization with sheep red blood cells. Original magnification, × 5. (Right) Number of germinal centres per total area and percentage of germinal centres per total area are shown by bar diagrams. Data represent typical results of three analyzed mice per group. *P<0.05.
Figure 8
Figure 8
Grb2fl/fl mb1cre/+ mice have impaired IgG secondary and memory responses to hCMV-derived virus-like particles. (A) Anti-virus-like particles (VLP)-specific IgM and IgG levels after immunization with hCMV VLPs. (B) In all, 90 days after the secondary immunization, B cells were purified by complement-mediated T-cell lysis and anti-CD19 beads and stained with anti-IgG. Not preimmunized mice: control mice without VLP immunizations. (C) In all, 2 × 10⁶ cells each from (B) were i.v. injected into RAG1−/− mice. Seven days after transfer, recipient mice were immunized with VLPs again and VLP-specific IgG was measured. (D) In all, 21 days after VLP immunization (28 days after adoptive transfer), the number of IgG-secreting cells of RAG1−/− recipient mice from the spleen was determined by ELISPOT. *P<0.05; **P<0.01; ***P<0.001.

Similar articles

Cited by

References

    1. Buday L, Downward J (1993) Epidermal growth factor regulates p21ras through the formation of a complex of receptor, Grb2 adapter protein, and Sos nucleotide exchange factor. Cell 73: 611–620 - PubMed
    1. Cheng AM, Saxton TM, Sakai R, Kulkarni S, Mbamalu G, Vogel W, Tortorice CG, Cardiff RD, Cross JC, Muller WJ, Pawson T (1998) Mammalian Grb2 regulates multiple steps in embryonic development and malignant transformation. Cell 95: 793–803 - PubMed
    1. Coughlin JJ, Stang SL, Dower NA, Stone JC (2005) RasGRP1 and RasGRP3 regulate B cell proliferation by facilitating B cell receptor-Ras signaling. J Immunol 175: 7179–7184 - PubMed
    1. Egan SE, Giddings BW, Brooks MW, Buday L, Sizeland AM, Weinberg RA (1993) Association of Sos Ras exchange protein with Grb2 is implicated in tyrosine kinase signal transduction and transformation. Nature 363: 45–51 - PubMed
    1. Engels N, Konig LM, Heemann C, Lutz J, Tsubata T, Griep S, Schrader V, Wienands J (2009) Recruitment of the cytoplasmic adaptor Grb2 to surface IgG and IgE provides antigen receptor-intrinsic costimulation to class-switched B cells. Nat Immunol 10: 1018–1025 - PubMed

Publication types

MeSH terms