

Material property estimation for tubes and arteries using ultrasound radiation force and analysis of propagating modes
- PMID: 21428498
- PMCID: PMC3078026
- DOI: 10.1121/1.3533735
Material property estimation for tubes and arteries using ultrasound radiation force and analysis of propagating modes
Abstract
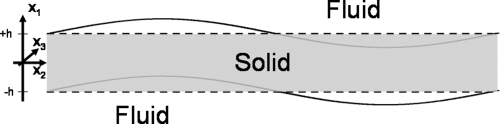
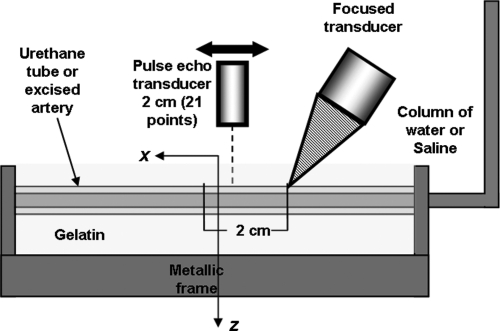
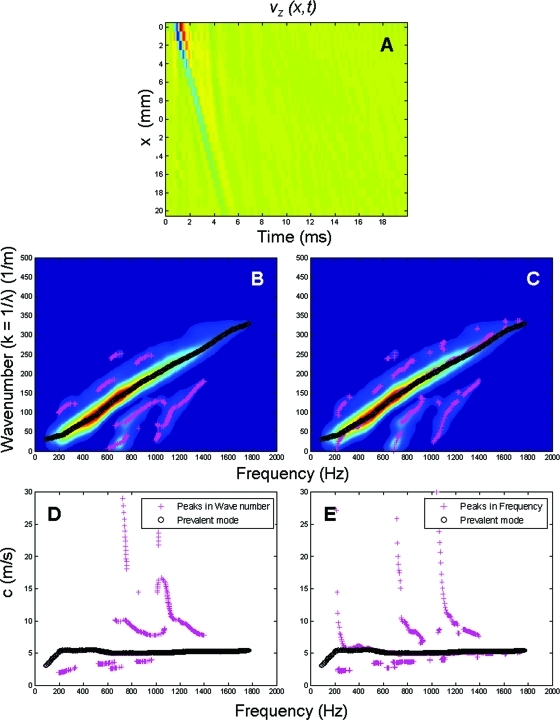
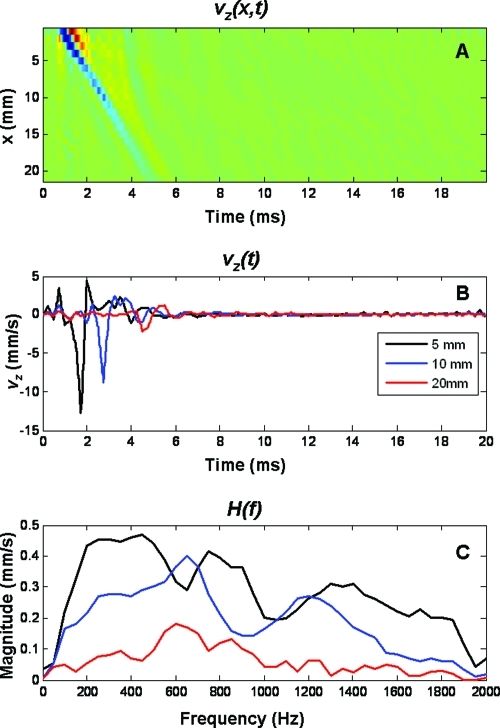
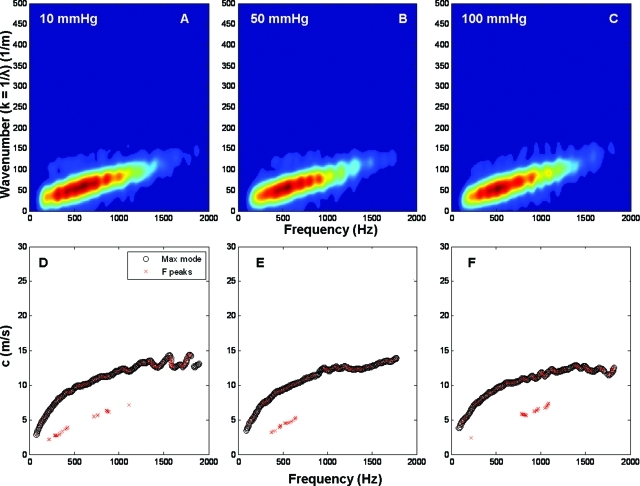
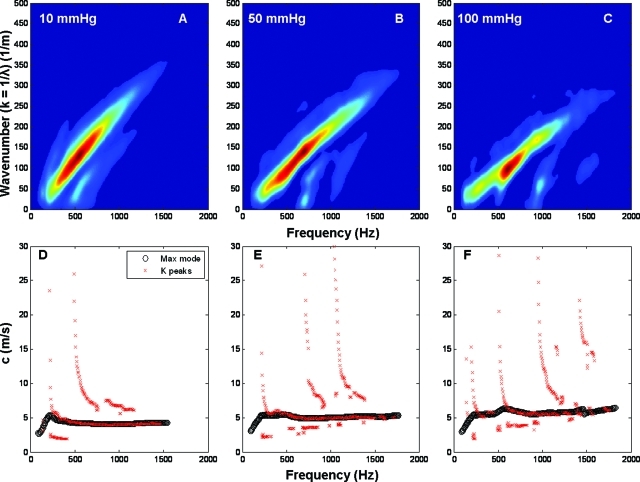
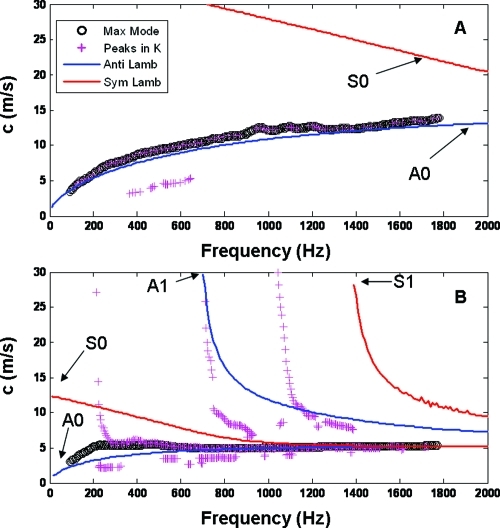
Arterial elasticity has been proposed as an independent predictor of cardiovascular diseases and mortality. Identification of the different propagating modes in thin shells can be used to characterize the elastic properties. Ultrasound radiation force was used to generate local mechanical waves in the wall of a urethane tube or an excised pig carotid artery. The waves were tracked using pulse-echo ultrasound. A modal analysis using two-dimensional discrete fast Fourier transform was performed on the time-space signal. This allowed the visualization of different modes of propagation and characterization of dispersion curves for both structures. The urethane tube/artery was mounted in a metallic frame, embedded in tissue-mimicking gelatin, cannulated, and pressurized over a range of 10-100 mmHg. The k-space and the dispersion curves of the urethane tube showed one mode of propagation, with no effect of transmural pressure. Fitting of a Lamb wave model estimated Young's modulus in the urethane tube around 560 kPa. Young's modulus of the artery ranged from 72 to 134 kPa at 10 and 100 mmHg, respectively. The changes observed in the artery dispersion curves suggest that this methodology of exciting mechanical waves and characterizing the modes of propagation has potential for studying arterial elasticity.
© 2011 Acoustical Society of America
Figures
Similar articles
-
Noninvasive method for estimation of complex elastic modulus of arterial vessels.IEEE Trans Ultrason Ferroelectr Freq Control. 2005 Apr;52(4):642-52. doi: 10.1109/tuffc.2005.1428047. IEEE Trans Ultrason Ferroelectr Freq Control. 2005. PMID: 16060513
-
Modal analysis of ultrasound radiation force generated shear waves on arteries.Annu Int Conf IEEE Eng Med Biol Soc. 2010;2010:2585-8. doi: 10.1109/IEMBS.2010.5626667. Annu Int Conf IEEE Eng Med Biol Soc. 2010. PMID: 21096176
-
Quantitative assessment of arterial wall biomechanical properties using shear wave imaging.Ultrasound Med Biol. 2010 Oct;36(10):1662-76. doi: 10.1016/j.ultrasmedbio.2010.07.004. Ultrasound Med Biol. 2010. PMID: 20800942
-
Multidirectional Estimation of Arterial Stiffness Using Vascular Guided Wave Imaging with Geometry Correction.Ultrasound Med Biol. 2018 Apr;44(4):884-896. doi: 10.1016/j.ultrasmedbio.2017.12.009. Ultrasound Med Biol. 2018. PMID: 29402485
-
Review: Mechanical Characterization of Carotid Arteries and Atherosclerotic Plaques.IEEE Trans Ultrason Ferroelectr Freq Control. 2016 Oct;63(10):1613-1623. doi: 10.1109/TUFFC.2016.2572260. Epub 2016 May 26. IEEE Trans Ultrason Ferroelectr Freq Control. 2016. PMID: 27249826 Review.
Cited by
-
Measurement of wave propagation through a tube using dual transducers for elastography in arteries.Phys Med Biol. 2022 Nov 11;67(22):10.1088/1361-6560/ac9c3f. doi: 10.1088/1361-6560/ac9c3f. Phys Med Biol. 2022. PMID: 36265476 Free PMC article.
-
Phase velocities and attenuations of shear, Lamb, and Rayleigh waves in plate-like tissues submerged in a fluid (L).J Acoust Soc Am. 2011 Dec;130(6):3549-52. doi: 10.1121/1.3654029. J Acoust Soc Am. 2011. PMID: 22225009 Free PMC article.
-
On the Challenges Associated with Obtaining Reproducible Measurements Using SWEI in the Median Nerve.Ultrasound Med Biol. 2020 May;46(5):1092-1104. doi: 10.1016/j.ultrasmedbio.2019.12.023. Epub 2020 Feb 11. Ultrasound Med Biol. 2020. PMID: 32057471 Free PMC article.
-
Use of Shear Wave Ultrasound Vibrometry for Detection of Simulated Esophageal Malignancy in Ex Vivo Porcine Esophagi.Biomed Phys Eng Express. 2016;2(6):065002. doi: 10.1088/2057-1976/2/6/065002. Epub 2016 Nov 23. Biomed Phys Eng Express. 2016. PMID: 28948043 Free PMC article.
-
Ultrasound Shear Elastography With Expanded Bandwidth (USEWEB): A Novel Method for 2D Shear Phase Velocity Imaging of Soft Tissues.IEEE Trans Med Imaging. 2024 May;43(5):1910-1922. doi: 10.1109/TMI.2024.3352097. Epub 2024 May 2. IEEE Trans Med Imaging. 2024. PMID: 38198276 Free PMC article.
References
-
- Dolan E., Thijs L., Li Y., Atkins N., McCormack P., McClory S., O’Brien E., Staessen J. A., and Stanton A. V., “Ambulatory arterial stiffness index as a predictor of cardiovascular mortality in the Dublin Outcome Study,” Hypertension 47, 365–370 (2006).10.1161/01.HYP.0000200699.74641.c5 - DOI - PubMed
-
- Laurent S., Boutouyrie P., Asmar R., Gautier I., Laloux B., Guize L., Ducimetiere P., and Benetos A., “Aortic stiffness is an independent predictor of all-cause and cardiovascular mortality in hypertensive patients,” Hypertension 37, 1236–1241 (2001). - PubMed
Publication types
MeSH terms
Substances
Grants and funding
LinkOut - more resources
Full Text Sources
Other Literature Sources