. 2011 Mar 23;31(12):4456-65.
doi: 10.1523/JNEUROSCI.6042-10.2011.

Input-specific critical periods for experience-dependent plasticity in layer 2/3 pyramidal neurons

Affiliations

Input-specific critical periods for experience-dependent plasticity in layer 2/3 pyramidal neurons

Jing A Wen et al. J Neurosci. .

Abstract

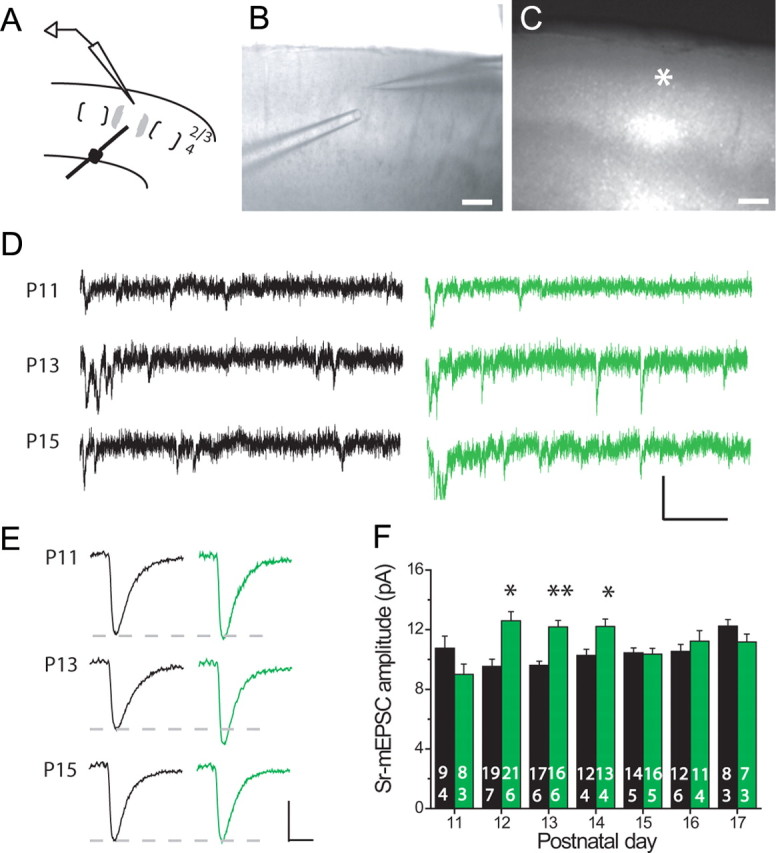
Critical periods for experience-dependent plasticity have been well characterized within sensory cortex, in which the ability of altered sensory input to drive firing rate changes has been demonstrated across brain areas. Here we show that rapid experience-dependent changes in the strength of excitatory synapses within mouse primary somatosensory cortex exhibit a critical period that is input specific and mechanistically distinct in layer 2/3 pyramidal neurons. Removal of all but a single whisker [single whisker experience (SWE)] can trigger the strengthening of individual glutamatergic synaptic contacts onto layer 2/3 neurons only during a short window during the second and third postnatal week. At both layer 4 and putative 2/3 inputs, SWE-triggered plasticity has a discrete onset, before which it cannot be induced. SWE synaptic strengthening is concluded at both inputs after the beginning of the third postnatal week, indicating that both types of inputs display a critical period for experience-dependent plasticity. Importantly, the timing of this critical period is both delayed and prolonged for layer 2/3-2/3 versus layer 4-2/3 excitatory synapses. Furthermore, plasticity at layer 2/3 inputs does not invoke the trafficking of calcium-permeable, GluR2-lacking AMPA receptors, whereas it sometimes does at layer 4 inputs. The dissociation of critical period timing and plasticity mechanisms at layer 4 and layer 2/3 synapses, despite the close apposition of these inputs along the dendrite, suggests remarkable specificity for the developmental regulation of plasticity in vivo.


Figures

Figure 1.
Figure 1.
SWE induces rapid increase in evoked Sr–mEPSC amplitude at layer 4-2/3 excitatory synapses only during a short developmental window. A, Schematic of stimulating and recording electrode placement for measuring layer 4-2/3 Sr–mEPSCs. B, Bright-field image of recording configuration in one barrel column. Scale bar, 200 μm. C, Low-magnification fluorescence image of the spared barrel column with strong signal located in layer 4 (barrel column indicated with asterisk). Scale bar, 200 μm. D, Example traces from control (black) and SWE (green) at postnatal age P11, P13, and P15. Calibration: 20 pA, 100 ms. E, Averaged traces of evoked Sr–mEPSCs from all cells at P11, P13, and P15. Calibration: 5 pA, 5 ms. Dashed line indicates the control amplitude for comparison. F, Mean amplitude of evoked Sr–mEPSCs recorded at postnatal ages P11–P17 from control (black) and SWE-treated (green) animals at layer 4-2/3 synapses. The number of cells (top) and animals (bottom) used are indicated on the bar graph. *p < 0.05, **p < 0.01 between age-matched control and SWE-treated cell groups by age using Mann–Whitney U test.
Figure 2.
Figure 2.
SWE drives CP-AMPARs to layer 4-2/3 synapses only at P13 but not P14. A, Schematics of electrode placement for control (black) and SWE-treated (green) tissue at layer 4-2/3 synapses. B, Example layer 2/3 pyramidal cells from a P13 control (black) and an SWE-treated (green) animal showing layer 4-evoked AMPA–EPSCs recorded at −40, −20, 0, +20, and +40 mV holding potentials. Calibration: 20 pA, 20 ms. The SWE cell shows clear EPSC rectification at positive holding potentials compared with the control cell. C, Normalized AMPA–EPSC amplitude (to amplitude at −40 mV) as a function of holding membrane potential (I–V curve) for control and SWE animals at P13. D, Example cells from a P14 control and an SWE animal as in B). Calibration: 10 pA, 20 ms. E, I–V curves for control and SWE at P14 as in C. F, Rectification index for control and SWE animals at P13 and P14 at layer 4-2/3 synapses. G, Scatter plot of Sr–mEPSC decay time for control and SWE-treated animals at layer 4-2/3 pathway from P11–P17. H, Mean Sr–mEPSC decay time for layer 4-2/3 pathway. *p < 0.05.
Figure 3.
Figure 3.
SWE triggers a rapid increase in evoked Sr–mEPSC amplitude at layer 2/3-2/3 excitatory synapses. A, Schematic of stimulating and recording electrode placement for measuring layer 2/3-2/3 Sr–mEPSCs. B, Bright-field image of recording configuration in one barrel column. Scale bar, 200 μm. C, Example traces from control (black) and SWE (green) at postnatal age P12, P14, and P17. Calibration: 20 pA, 100 ms. D, Average traces of evoked Sr–mEPSCs for control and SWE animals. Calibration: 5 pA, 10 ms. E, Mean amplitude of evoked Sr–mEPSCs recorded at postnatal ages P11–P17 for control and SWE animals at layer 2/3-2/3 synapses. The number of cells (top) and animals (bottom) used are indicated on the bar graph. *p < 0.05, **p < 0.01 between age-matched control and SWE-treated cell groups by age using Mann–Whitney U test.
Figure 4.
Figure 4.
SWE does not drive CP-AMPARs to layer 2/3-2/3 synapses. A, Schematics of electrode placement for control (black) and SWE-treated (green) tissue at layer 2/3-2/3 synapses. B, Example cells from P13 control and SWE animals showing layer 2/3-evoked AMPA–EPSCs at holding potentials −40, −20, 0, +20, and +40 mV. Calibration: 20 pA, 20 ms. C, I–V curves for control and SWE animals at P13. D, Example cells from P14 control and SWE animals as in A. Calibration: 30 pA, 20 ms. E, I–V curves for control and SWE animals at P14. F, Configuration of dual-pathway recording in SWE-treated tissue. One stimulation electrode is placed in layer 4 and the other is in layer 2 of the same barrel column while recording from the same layer 2/3 neuron. G, Example traces (peak-scaled) from dual-pathway recordings of a P13 SWE-treated animal at holding potentials −40, −20, 0, + 20, and +40 mV. Calibration: 30 pA, 10 ms. Layer 4-2/3 synapse shows more rectification than layer 2/3-2/3 synapse within the same postsynaptic neuron. H, Rectification index for P13 and P14 control and SWE-treated animals at layer 2/3-2/3 synapses. I, Scatter plot of Sr–mEPSC decay time at layer 2/3-2/3 pathway from P11–P17.
Figure 5.
Figure 5.
Dual-pathway recordings show that SWE-induced plasticity is age and pathway specific. A, Mean amplitude of evoked Sr–mEPSCs in dual-pathway recordings from control (black) and SWE (green) littermates at P12. B, Example experiment from control and SWE animals showing average Sr–mEPSC traces at two inputs onto the same postsynaptic cell. Top, Schematics of experimental recording configuration. 1, Layer 4-2/3 control; 2, layer 2/3-2/3 control; 3, layer 4-2/3 SWE; 4, layer 2/3-2/3 SWE. Calibration: 5 pA, 5 ms. SWE leads to a pronounced increase in Sr–mEPSC amplitude at layer 4-2/3 synapses (3 compared with 1) but minimal change at layer 2/3-2/3 synapses (4 compared with 2). C, Scatter plot of dual-pathway recorded Sr–mEPSC amplitudes for layer 2/3 neurons with inputs arising from within the spared barrel column and from neighboring, deprived columns. Top, Schematic of dual-pathway recording configuration; bottom, scatter plot; W, within column; N, neighboring column. D, Mean Sr–mEPSCs amplitude for layer 2/3-2/3 synapses with inputs from within the spared barrel column and from neighboring deprived column. *p < 0.05.
Figure 6.
Figure 6.
NMDAR properties are different between layer 4-2/3 and layer 2/3-2/3 excitatory synapses. A, Peak-scaled averaged traces of NMDA–EPSC recorded at +40 mV for layer 4-2/3 (black) and layer 2/3-2/3 (red) pathways. Calibration: 100 pA, 100 ms. B, Decay kinetics of NMDA–EPSCs (+40 mV) for dual-pathway recordings at layer 4-2/3 and 2/3-2/3 pathways. Single-exponential decay function was fitted to NMDA–EPSC traces from peak to 200 ms after the stimulus artifact, and decay constant τ was plotted. Filled squares are values for individual cells. Open squares are the mean τ. Error bars indicate SEM. *p < 0.05 by paired Student's t test. C, Ifenprodil (Ifen) sensitivity. Top, Schematic of dual-cell recording in control tissue. Bottom left, Example traces of NMDA–EPSC before (−Ifen) and after (+Ifen) ifenprodil treatment for dual recordings from both pathways. Calibration: 50 pA, 100 ms. D, Percentage ifenprodil-sensitive currents for layer 4-2/3 and 2/3-2/3 pathways. Scatter plot and the mean (± SEM) are presented. E, AMPA/NMDA ratio for both pathways. F, Example traces of EPSCs recorded at −70 and +40 mV for AMPA/NMDA ratio in dual-pathway recording configuration. Calibration: 50 pA, 20 ms.
Figure 7.
Figure 7.
Layer 4-2/3 and 2/3-2/3 synapses show different developmental maturation of Sr–mEPSCs. A, Example traces of evoked Sr–mEPSCs from dual recording of two pathways in a P13 control cell. Top, Schematics of dual recording. Bottom left, Example traces of evoked Sr–mEPSCs at layer 4-2/3 (black) and layer 2/3-2/3 (red) synapses from the same postsynaptic cell. Calibration: 10 pA, 100 ms. Bottom right, Average traces. Calibration: 5 pA, 5 ms. B, Scatter plots of Sr–mEPSC amplitude recorded at P13 at both pathways. C, Example traces of a P14 control cell. Calibration is the same as in A. D, The same as in B for P14–P15. E, Mean rise time (black) and decay time (gray) of Sr–mEPSCs at P13 (left) and P14–P15 (right). F, Mean Sr–mEPSC amplitude from P11 to P17 at layer 4-2/3 and layer 2/3-2/3 pathways from single-pathway experiments. *p < 0.05.

Similar articles

Cited by

References

    1. Abdul-Ghani MA, Valiante TA, Pennefather PS. Sr2+ and quantal events at excitatory synapses between mouse hippocampal neurons in culture. J Physiol. 1996;495:113–125. - PMC - PubMed
    1. Adesnik H, Nicoll RA. Conservation of glutamate receptor 2-containing AMPA receptors during long-term potentiation. J Neurosci. 2007;27:4598–4602. - PMC - PubMed
    1. Banerjee A, Meredith RM, Rodríguez-Moreno A, Mierau SB, Auberson YP, Paulsen O. Double dissociation of spike timing-dependent potentiation and depression by subunit-preferring NMDA receptor antagonists in mouse barrel cortex. Cereb Cortex. 2009;19:2959–2969. - PMC - PubMed
    1. Barth AL, Malenka RC. NMDAR EPSC kinetics do not regulate the critical period for LTP at thalamocortical synapses. Nat Neurosci. 2001;4:235–236. - PubMed
    1. Barth AL, McKenna M, Glazewski S, Hill P, Impey S, Storm D, Fox K. Upregulation of cAMP response element-mediated gene expression during experience-dependent plasticity in adult neocortex. J Neurosci. 2000;20:4206–4216. - PMC - PubMed

Publication types

MeSH terms

LinkOut - more resources