Comparative Study
. 2011 Mar 23;31(12):4583-92.
doi: 10.1523/JNEUROSCI.5816-10.2011.

Comparison of strategy signals in the dorsolateral and orbital prefrontal cortex

Affiliations
Comparative Study

Comparison of strategy signals in the dorsolateral and orbital prefrontal cortex

Satoshi Tsujimoto et al. J Neurosci. .

Abstract

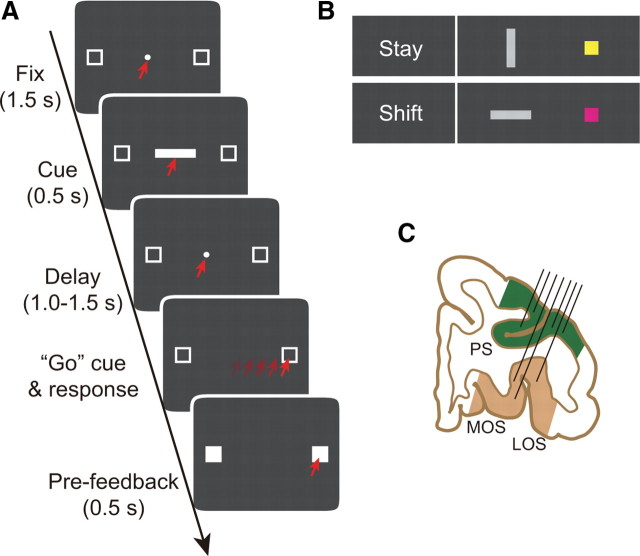
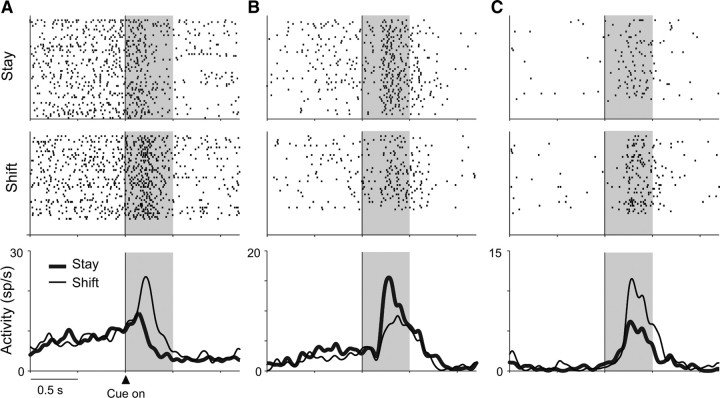
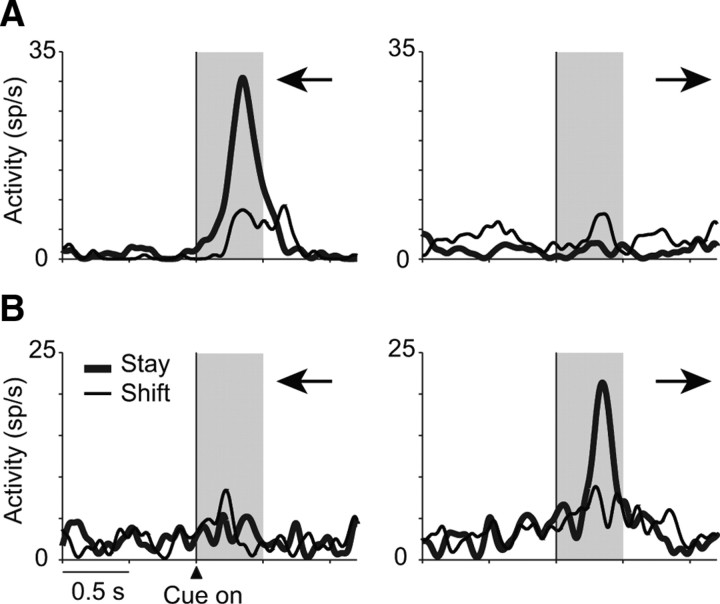
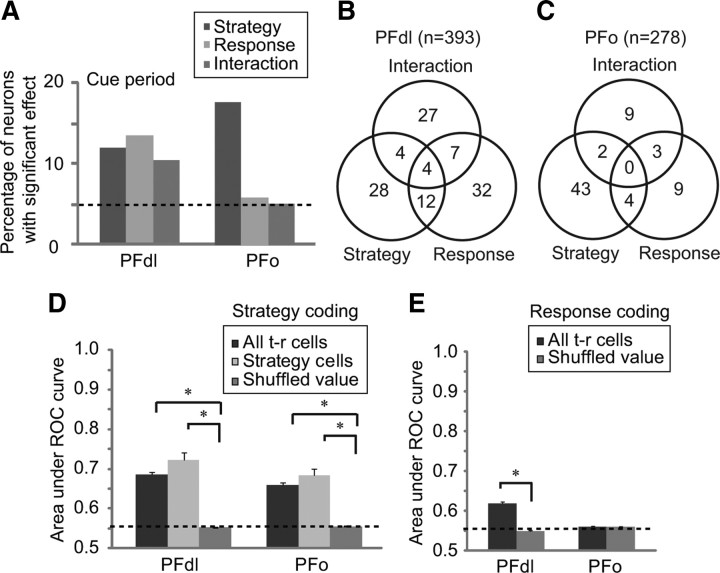
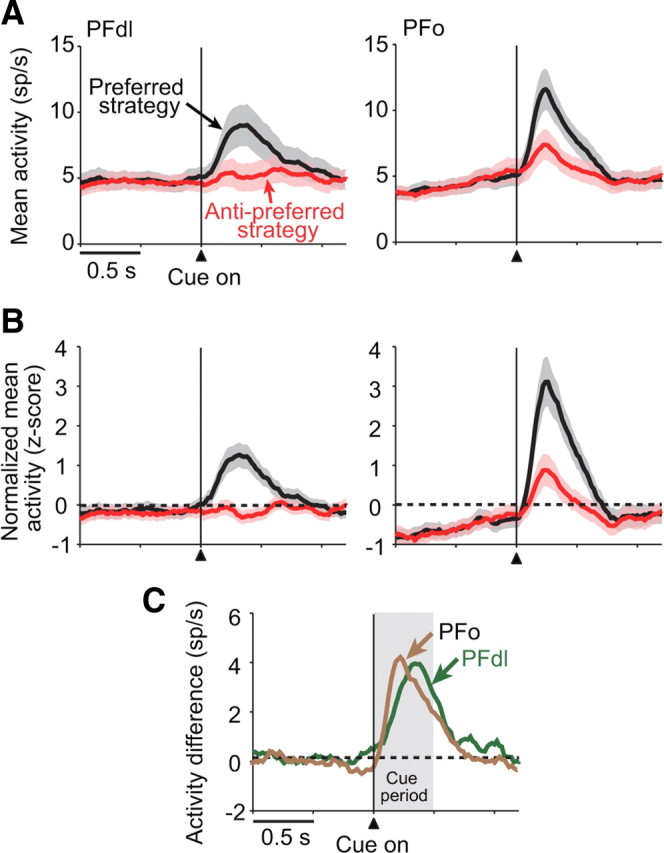
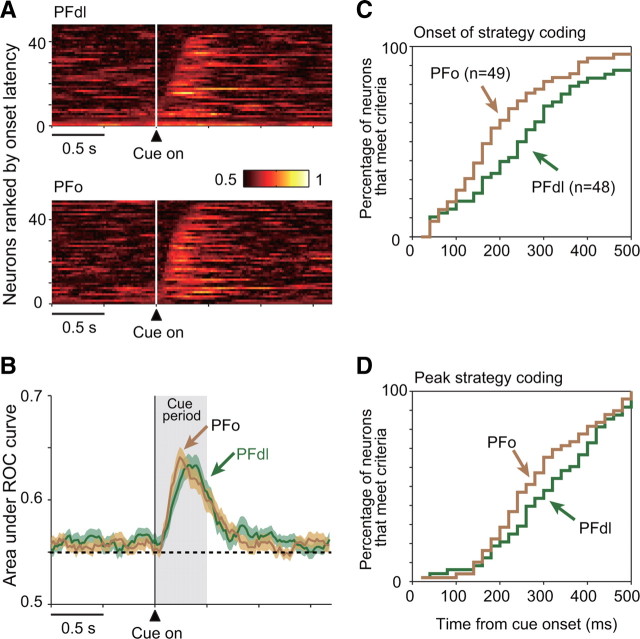
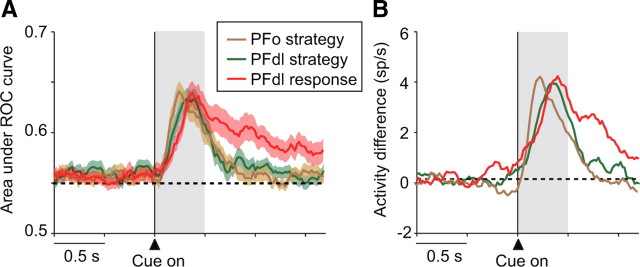
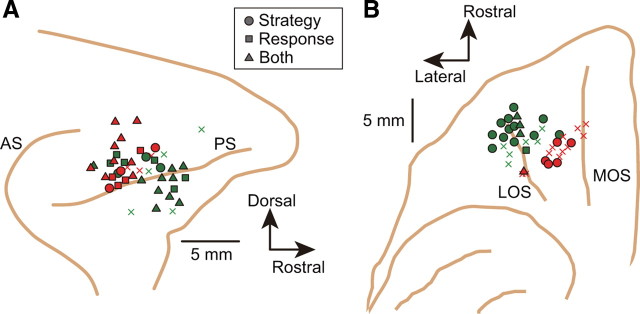
Abstract behavior-guiding rules and strategies allow monkeys to avoid errors in rarely encountered situations. In the present study, we contrasted strategy-related neuronal activity in the dorsolateral prefrontal cortex (PFdl) and the orbital prefrontal cortex (PFo) of rhesus monkeys. On each trial of their behavioral task, the monkeys responded to a foveal visual cue by making a saccade to one of two spatial targets. One response required a leftward saccade, the other required a saccade of equal magnitude to the right. The cues instructed the monkeys to follow one of two response strategies: to stay with their most recent successful response or to shift to the alternative response. Neurons in both areas encoded the stay and shift strategies after the cue appeared, but there were three major differences between the PFo and the PFdl: (1) many strategy-encoding cells in PFdl also encoded the response (left or right), but few, if any, PFo cells did so; (2) strategy selectivity appeared earlier in PFo than in PFdl; and (3) on error trials, PFo neurons encoded the correct strategy-the one that had been cued but not implemented-whereas in PFdl the strategy signals were weak or absent on error trials. These findings indicate that PFo and PFdl both contribute to behaviors guided by abstract response strategies, but do so differently, with PFo encoding a strategy and PFdl encoding a response based on a strategy.


Figures

Figure 1.
Figure 1.
Behavioral task and recording locations. A, Sequence of task events for correct trials, from top to bottom. Each dark gray rectangle represents the video monitor viewed by the monkey. The red arrows indicate the target of gaze. B, Cues and the response strategies each instructed. C, Coronal section based on MRI. Angle of penetration (black lines) allowed sampling of neuronal activity in both PFdl (green) and PFo (brown). Fix, Fixation period; LOS, lateral orbital sulcus; MOS, medial orbital sulcus; PS, principal sulcus.
Figure 2.
Figure 2.
Three examples of strategy-selective neurons. A–C, Neuron activity aligned on cue onset. Raster displays show spike times sorted chronologically from top to bottom with spike-density averages below each display. Stay (thick lines) and shift (thin lines) responses shown separately. Correct trials only. Background shading represents the cue period. A, PFdl neuron from monkey 2. B, PFo neuron from monkey 1. C, PFo neuron from monkey 2. sp/s, Spikes per second.
Figure 3.
Figure 3.
Two PFdl neurons with cue-period activity encoding both strategy and response. A, Neuron from monkey 1 encoding a combination of the stay strategy and leftward responses (for details on the format, see Fig. 2). Black arrows show the direction of response. B, Neuron from monkey 2 encoding the stay strategy effect and rightward responses.
Figure 4.
Figure 4.
A, Results of two-way ANOVA, main and interactive effects. Dashed line represents percentage expected by chance. B, C, Venn diagrams of results from ANOVA for PFdl (B) and PFo (C), showing main effects, interactive effects, and their combinations. D, Strategy selectivity as measured by ROC analysis. Area under ROC curve was computed for all task-related (t-r) cells and cells with significant strategy effects. The value of the shuffled ROC gives value expected by chance (dashed line). E, Response selectivity as measured by area under ROC curve computed for the all task-related cells. Error bars indicate SEM. *p < 0.001.
Figure 5.
Figure 5.
Strategy-selective population means. A, Mean population activity (shaded area, SEM) for PFdl (left) and PFo (right) neurons with significant strategy-selective activity during the cue period (n = 48 and 49, respectively), computed separately for each neuron's preferred (black) and anti-preferred (red) strategy. Vertical line shows the time of cue onset. B, Normalized (z-score) population averages for the same data as shown in A. C, Difference in activity between the preferred and anti-preferred strategies.
Figure 6.
Figure 6.
A, Sliding ROC plots for PFdl (top) and PFo (bottom) neurons with strategy-selective activity during the cue period (as in Fig. 5A), with the area under the ROC curve color-coded for each cell, ranked according to the onset of strategy selectivity. B, Means with SEM (shading) for the data in A. C, Cumulative fraction of neurons meeting criteria for the onset of strategy selectivity from cue onset. D, Cumulative fraction of neurons reaching peak strategy encoding by ROC analysis.
Figure 7.
Figure 7.
A, Sliding ROC plots for the response (left or right) chosen on each trial (red). This curve presents a measure of response coding in PFdl compared with the sliding ROC plots for strategy coding in PFdl (green) and PFo (brown) (see Fig. 6B). B, Response encoding in PFdl, measured by population activity means. Response coding is measured as the difference in activity between preferred and anti-preferred responses (red), plotted with the analogous difference means for strategy coding in PFdl (green) and PFo (brown) (see Fig. 5C).
Figure 8.
Figure 8.
A, Activity difference between preferred (pref) and anti-preferred (anti) strategies for the observed (red square) and shuffled data (blue points), for PFdl. The data for correct and error trials are shown on the abscissa and ordinate, respectively, with the distribution shown (top and right). For the calculation of error data, we used 42 neurons that showed a significant main effect of strategy by ANOVA and had at least one error trial. B, PFo results for 45 neurons, data shown as in A. C, Average population activity in the error trials (dashed lines) and correct trials (solid lines) for PFdl neurons with significant strategy-selective activity. Preferred and anti-preferred strategies correspond to each neuron's strategy preference for the correct trials. D, Strategy selectivity for PFo neurons, data shown as in C. n.s., Not significant.
Figure 9.
Figure 9.
Penetration sites. A, Penetration sites for PFdl recordings. Lateral view, composite of two monkeys. Each shape represents the site of an electrode array, which included four or more electrodes (green, monkey 1; red, monkey 2). Circles, squares, and triangles represent sites with one or more neurons showing strategy-selective cells, response-selective cells, or both, respectively. Xs mark penetration sites where none of the recorded neurons showed significant effects for either response or strategy. B, Penetration sites for PFo recording, data shown as in A. AS, Arcuate sulcus; PS, principal sulcus; MOS, medial orbital sulcus; LOS, lateral orbital sulcus.

References

    1. Asaad WF, Rainer G, Miller EK. Task-specific neural activity in the primate prefrontal cortex. J Neurophysiol. 2000;84:451–459. - PubMed
    1. Baddeley A. Working memory. Curr Biol. 2010;20:R136–R140. - PubMed
    1. Barbas H. Anatomic organization of basoventral and mediodorsal visual recipient prefrontal regions in the rhesus monkey. J Comp Neurol. 1988;276:313–342. - PubMed
    1. Barbas H, Pandya DN. Architecture and intrinsic connections of the prefrontal cortex in the rhesus monkey. J Comp Neurol. 1989;286:353–375. - PubMed
    1. Barceló F, Knight RT. Both random and perseverative errors underlie WCST deficits in prefrontal patients. Neuropsychologia. 2002;40:349–356. - PubMed

Publication types

LinkOut - more resources