. 2011 Mar 23;31(12):4663-74.
doi: 10.1523/JNEUROSCI.5072-10.2011.

Constancy and variability in the output of a central pattern generator

Affiliations

Constancy and variability in the output of a central pattern generator

Brian J Norris et al. J Neurosci. .

Abstract

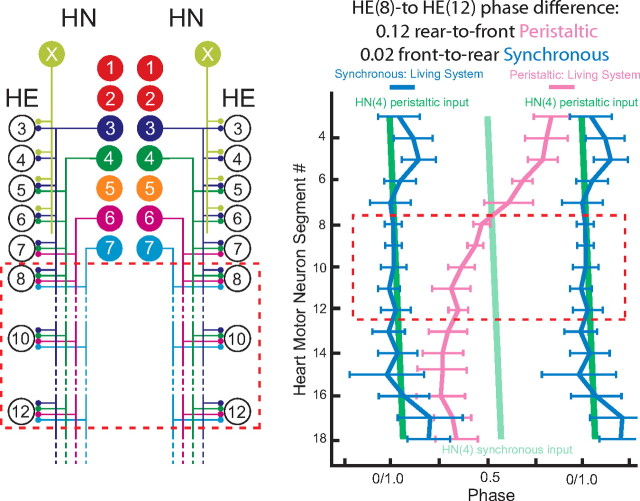
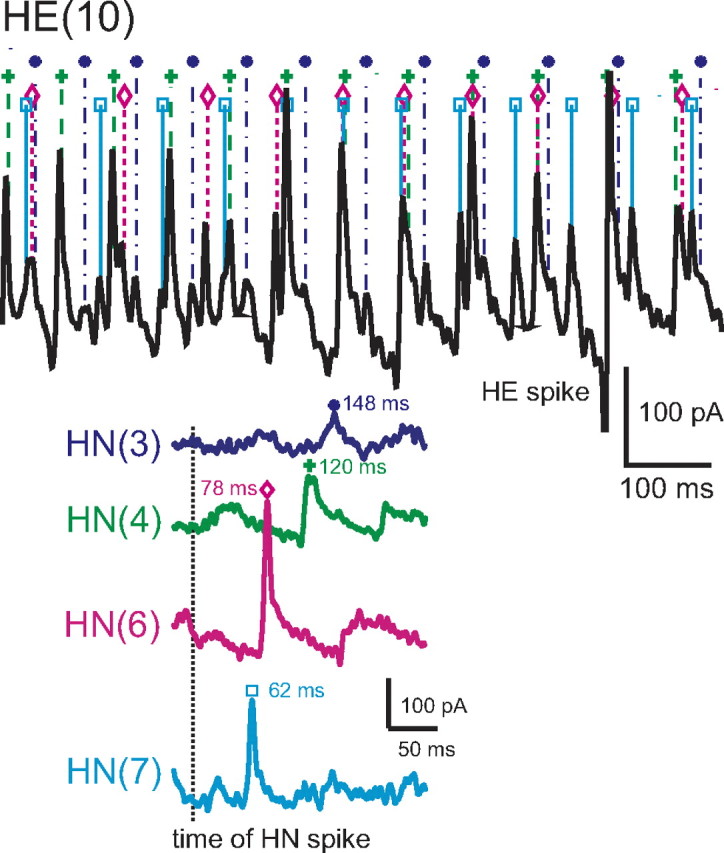
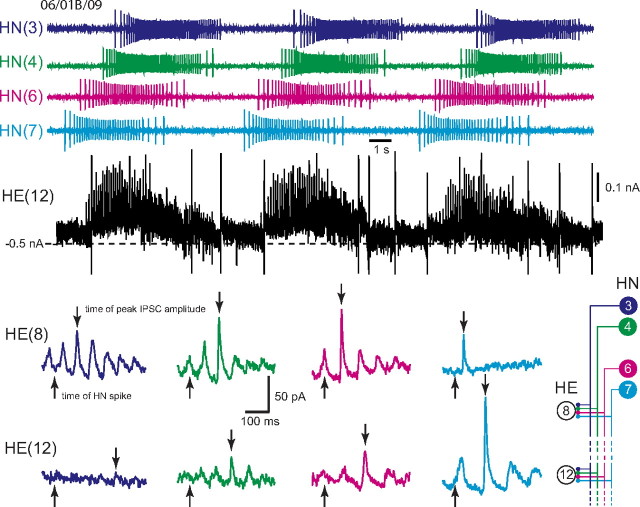
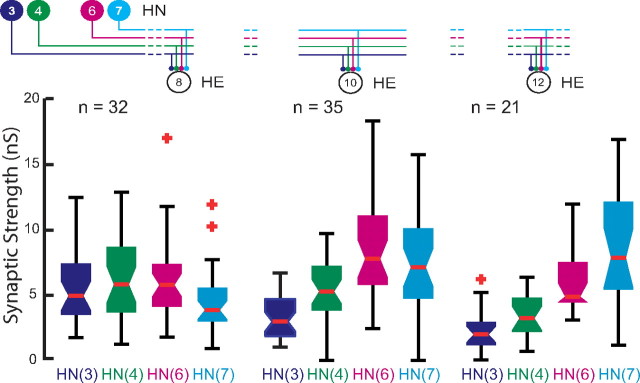
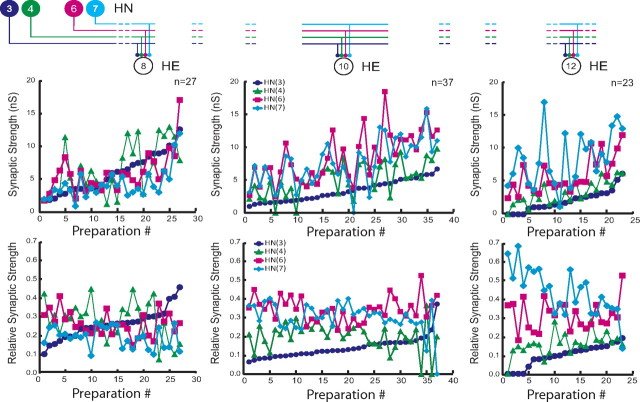
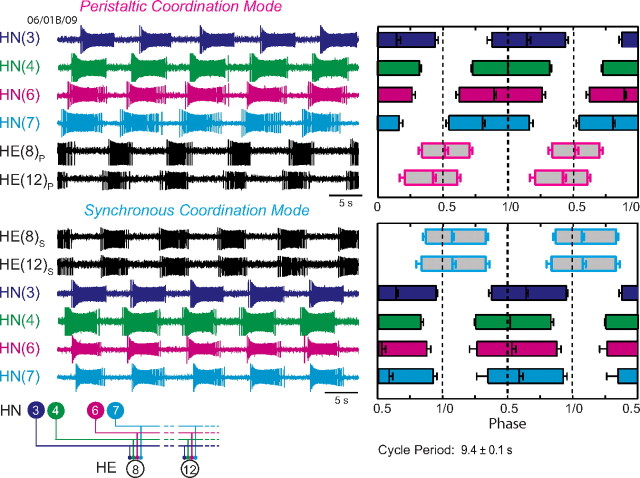
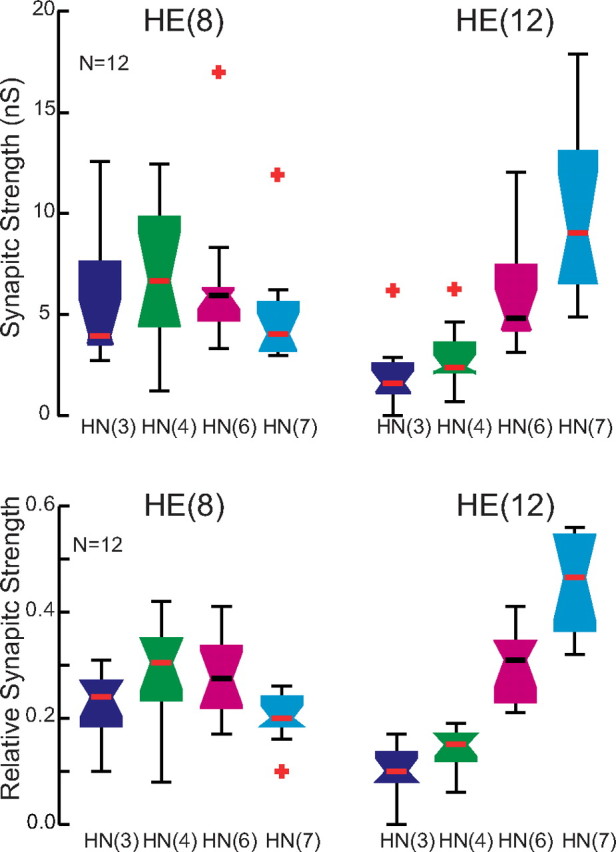
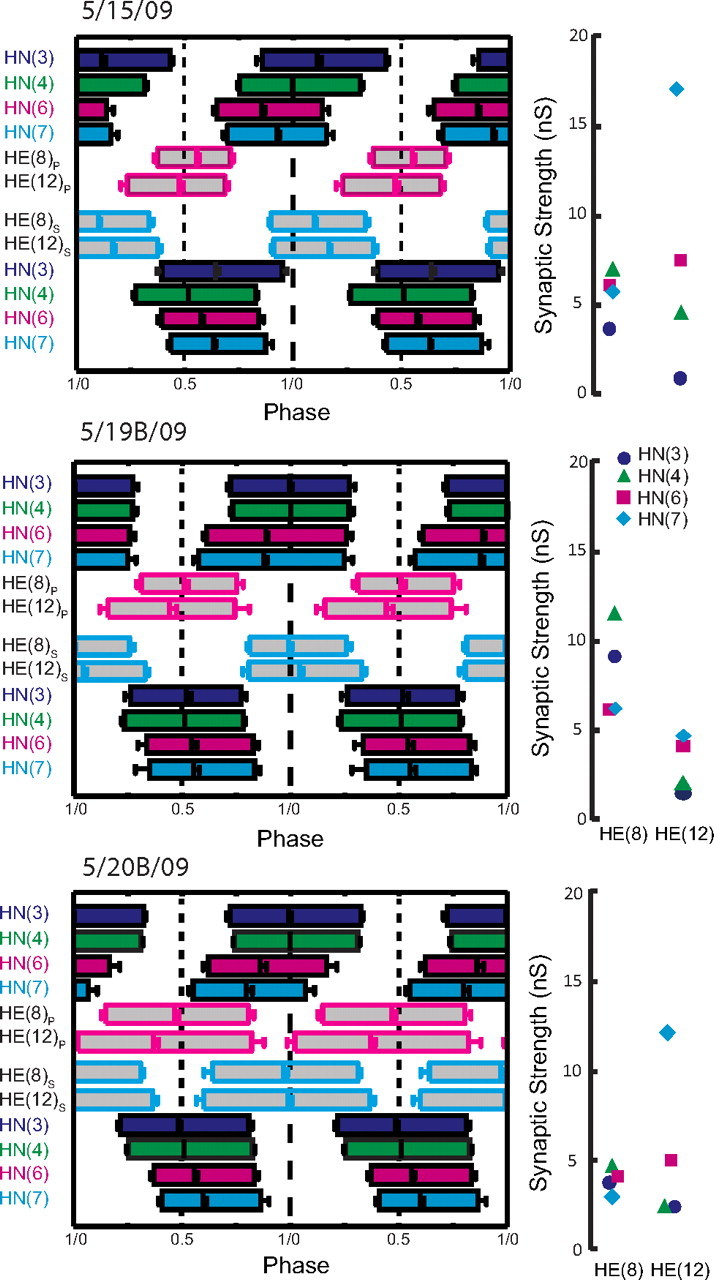
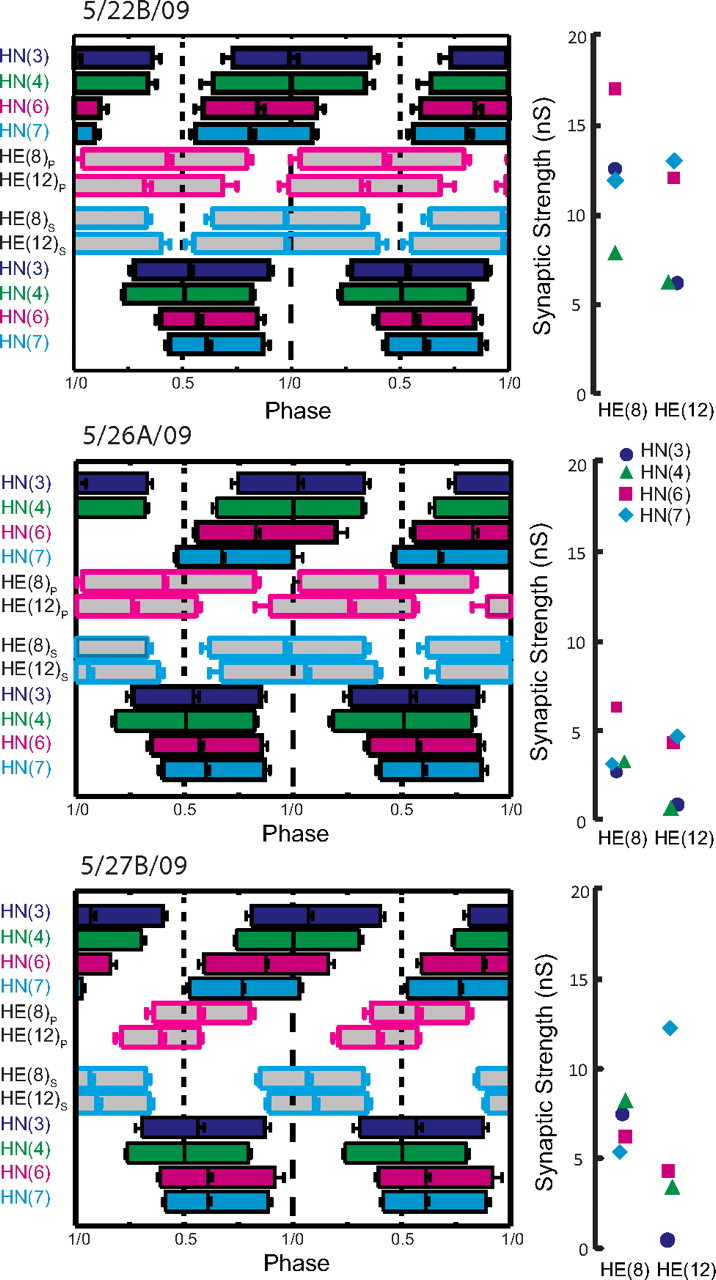
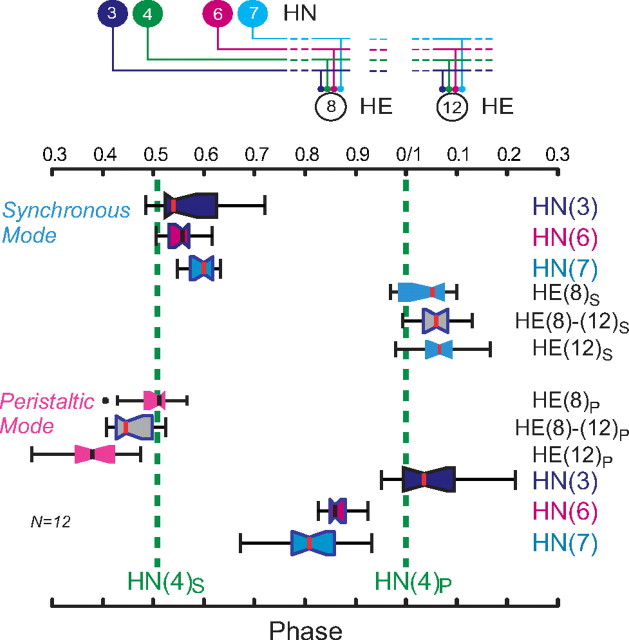
Experimental and corresponding modeling studies have demonstrated a twofold to fivefold variation of intrinsic and synaptic parameters across animals, whereas functional output is maintained. These studies have led to the hypothesis that correlated, compensatory changes in particular parameters can at least partially explain the biological variability in parameters. Using the leech heartbeat central pattern generator (CPG), we selected three different segmental motor neurons that fire in a functional phase progression but receive input from the same four premotor interneurons. Previous work suggested that the phase progression arises because the pattern of relative strength of the four inputs varies systematically across the segmental motor neurons. Nevertheless, there was considerable animal-to-animal variation in the absolute strengths of these connections. We tested the hypothesis that functional output is maintained in the face of variation in the absolute strength of connections because relative strengths onto particular motor neurons are maintained. We found that relative strength is not strictly maintained across animals even as functional output is maintained, and animal-to-animal variations in relative strength of particular inputs do not correlate strongly with output phase. In parallel with this variation in synaptic strength, the firing phase of the premotor inputs to these motor neurons varies considerably across individuals. We conclude that the number (four) of inputs to each motor neuron, which each vary in strength, and the phase diversity of the temporal pattern of input from the CPG diminish the influence of individual inputs. We hypothesize that each animal arrives at a unique solution for how the network produces functional output.


Figures

Figure 1.
Figure 1.
Connections from the heart interneurons of the leech heartbeat CPG onto motor neurons in the first 12 midbody segmental ganglia and the bilateral output pattern of heart motor neurons. Left, Bilateral circuit diagram including all the HN interneurons of the CPG [identified HN(3), HN(4), HN(6), HN(7) and unidentified HN(X)] and their pattern of synaptic connections to HE motor neurons in HE(3)–HE(12). Large colored circles are cell bodies and associated input processes. Lines indicate cell processes, and small colored/black circles indicate inhibitory chemical synapses. Standard colors for the identified interneurons are used (for color code, see Materials and Method), e.g., lime green is used for the X interneuron. Right, Simplified composite phase diagram showing the average ± SD phase of heart motor neuron output in the living system for both peristaltic and synchronous coordination. Data are replotted from Norris et al. (2007b) and represent averages from n = 61 different preparations. The bilateral absolute phase of each segmental motor neuron with the peristaltic HN(4) interneuron as the phase reference is shown. Two synchronous (blue) and one peristaltic (pink) phase curves are shown. The phase of the peristaltic HN(4) interneuron is indicated with a slanted green straight line, and the phase the corresponding synchronous HN(4) interneuron is indicated with a slanted light green straight line. The slopes of these lines reflect the conduction delays from segment to segment. In this study, we focused on the HE(8)–HE(12) motor neurons, and their representations are bordered by a red dashed line in each panel.
Figure 2.
Figure 2.
Accounting for all the inhibitory synaptic inputs to a HE(10) motor neuron. An HE(10) motor neuron was recorded in voltage clamp (holding potential −45 mV) simultaneously with extracellular recording from four ipsilateral premotor heart interneurons, HN(3), HN(4), HN(6), and HN(7). Here and throughout interneurons and motor neurons are indexed by segmental ganglion number, thus HN(7) is the heart interneuron of segmental ganglion 7, and all recordings are ipsilateral. One to three bursts of HN firing were analyzed in each preparation: in this preparation three were used. In the portion of one burst illustrated (preparation was in synchronous mode here), standard symbols and colors are used to plot each HN spike, and dropped dashed lines from each HN spike symbol indicate the associated IPSC in the HE current trace. For clarity only a short portion of the trace associated with the HN burst is illustrated. 100% of the recorded IPSCs over 3 bursts were matched by a spike recorded from one of the HN interneurons with the correct latency in this HE(10) motor neuron. HN spikes from 11 bursts (including the one illustrated) from each interneuron were also used to generate the spike-triggered averages of IPSCs in the motor neuron shown on the lower right. The vertical dashed line indicates the time of the triggering interneuronal spike, standard colors identify each spike-triggered average, and standard symbols indicate the latency of the peak average IPSC from this triggering event. Note that the amplitude of the individual IPSCs from each identified HN spike match the amplitude expected from the spike-triggered average.
Figure 3.
Figure 3.
Determining the absolute and relative synaptic strength of each input to a heart motor neuron. In the top, an HE(12) motor neuron was recorded in voltage clamp (holding potential, −45 mV) simultaneously with extracellular recording from four ipsilateral premotor heart interneurons, HN(3), HN(4), HN(6), and HN(7). HN spikes from 11 bursts (including the ones illustrated) from each interneuron were used to generate the spike-triggered averages of IPSCs in the HE(12) motor neuron, and subsequently similar recordings were used to generate the spike-triggered averages of IPSCs for the HE(8) motor neuron in the same preparation. Upward arrows indicate the time of the triggering HN spike, and the downward arrows indicate the peak of the averaged IPSC used to measure amplitude: standard colors identify each heart interneuron and associated spike-triggered average IPSC. Iconic unilateral circuit diagram (bottom right) identifies the recorded neurons. Preparations are specified by the day on which they were recorded: letters accompany the day designation if more than one preparation was recorded on that day.
Figure 4.
Figure 4.
Whisker-box diagram of absolute synaptic strength of inputs to the HE(8), HE(10), and HE(12) motor neurons determined as illustrated in Figure 3. Iconic unilateral circuit diagram (above) identifies the recorded neurons for each diagram, and standard colors are used to indicate the strength of each HN input in each diagram. Each box shows the median value at its waist and the third and first quartile at its top and base, respectfully. The whisker ends indicate the lowest datum still within 1.5 * IQR (interquartile range) of the lower quartile, and the highest datum still within 1.5 * IQR of the upper quartile with outliers indicated by red crosses. The strength profile across the four inputs, HN(3), HN(4), HN(6), and HN(7) interneurons, is distinctive for each motor neuron but with considerable variability in the strength of each input in each motor neurons across animals (n).
Figure 5.
Figure 5.
Viewing the animal-to-animal variation in absolute synaptic strength illustrated in Figure 3. Iconic unilateral circuit diagram (above) identifies the recorded neurons for each graph, and standard colors and symbols are used to indicate the strength of each HN input in each graph. Absolute strength (in nanosiemens; top graphs) or relative strength (bottom graphs) is plotted versus preparation ordered by the absolute or relative strength of the HN(3) input, respectively.
Figure 6.
Figure 6.
Determining the input and output temporal pattern of the HE(8) and HE (12) motor neurons. Left, Simultaneous extracellular recordings were made of ipsilateral HN(3), HN(4), HN(6), and HN(7) premotor interneurons (inputs) (standard color code) and HE(8) and HE (12) motor neurons (outputs) (black) in both peristaltic (P) and synchronous (S) coordination modes. Right, Summary phase diagram of the premotor interneurons (standard color code) and the HE(8) and HE(12) motor neurons in both the peristaltic (pink-outlined boxes) and synchronous (light blue-outlined boxes) coordination modes. For both motor neurons and interneurons, the average duty cycle is indicated by the length of the bar: the left edge of each bar indicates the average phase of the first spike of the burst, and the right edge indicates the average phase of the last spike of the burst. Average phase is indicated by a vertical line within the bar. Error bars indicate SDs. A phase diagram of the interneurons was first constructed from measurements of activity phase relative to the middle spike of the ipsilateral HN(4) interneuron for both synchronous and peristaltic coordination modes. To align these ipsilateral phase diagrams, the synchronous HN(4) interneuron was assigned a phase of 0.511, as measured with respect to the peristaltic HN(4) interneuron in bilateral recordings (Norris et al., 2006). All other synchronous interneurons were then offset by the same amount as the phase of the synchronous HN(4) interneuron.
Figure 7.
Figure 7.
Whisker-box diagrams of absolute and relative synaptic strength of inputs to the HE(8) and HE(12) motor neurons. Data were drawn from a series of 12 preparations in which the input and output temporal pattern of the HE(8) and HE(12) motor neurons was completely specified as illustrated in Figure 6 and in which the strength pattern of the inputs to both motor neurons was also measured, as illustrated in Figure 3. The strength profile across the four inputs, HN(3), HN(4), HN(6), and HN(7) interneurons (standard color code used), is similar to that for the larger population illustrated in Figure 4, indicating that our sample is representative.
Figure 8.
Figure 8.
Complete analysis of input and output temporal patterns and synaptic strength patterns (spatial pattern) for three different preparations from our sample of 12 (summarized in Fig. 7). Temporal patterns were determined as in Figure 6, but the two ipsilateral phase diagrams were fused into a composite for ease of presentation. The strength pattern of the inputs, determined as in Figure 3, is shown to the right of each composite phase diagram. Standard colors and symbols are used throughout. Preparations are specified by the day on which they were recorded: letters accompany the day designation if more than one preparation was recorded on that day.
Figure 9.
Figure 9.
Complete analysis of input and output temporal patterns and synaptic strength patterns (spatial pattern) for three different preparations from our sample of 12 (summarized in Fig. 7). Temporal patterns were determined as in Figure 6, but the two ipsilateral phase diagrams were fused into a composite for ease of presentation. The strength pattern of the inputs, determined as in Figure 3, is shown to the right of each composite phase diagram. Standard colors and symbols are used throughout. Preparations are specified by the day on which they were recorded: letters accompany the day designation if more than one preparation was recorded on that day.
Figure 10.
Figure 10.
Whisker-box diagrams of the (middle spike) phase of the HE(8) and HE(12) motor neurons (boxes light blue in synchronous coordination mode and pink in the synchronous coordination mode) and their inputs (standard color code used) for the series of 12 preparations in which the input and output temporal patterns and strength patterns were completely specified as illustrated in Figures 8 and 9. Iconic unilateral circuit diagram (above) identifies the recorded neurons. The gray whisker boxes show the intersegmental phase differences between the HE(8) and the HE(12) motor neurons for the two coordination modes. The median at the waist of these gray whisker boxes is placed exactly halfway between the median HE(8) phase and the median HE(12) phase for each coordination mode.

References

    1. Angstadt JD, Calabrese RL. Calcium currents and graded synaptic transmission between heart interneurons of the leech. J Neurosci. 1991;11:746–759. - PMC - PubMed
    1. García PS, Wright TM, Cunningham IR, Calabrese RL. Using a model to assess the role of the spatiotemporal pattern of inhibitory input and intrasegmental electrical coupling in the intersegmental and side-to-side coordination of motor neurons by the leech heartbeat central pattern generator. J Neurophysiol. 2008;100:1354–1371. - PMC - PubMed
    1. Goaillard JM, Taylor AL, Schulz DJ, Marder E. Functional consequences of animal-to-animal variation in circuit parameters. Nat Neurosci. 2009;12:1424–1430. - PMC - PubMed
    1. Grashow R, Brookings T, Marder E. Compensation for variable intrinsic neuronal excitability by circuit-synaptic interactions. J Neurosci. 2010;30:9145–9156. - PMC - PubMed
    1. Günay C, Edgerton JR, Jaeger D. Channel density distributions explain spiking variability in the globus pallidus: a combined physiology and computer simulation database approach. J Neurosci. 2008;28:7476–7491. - PMC - PubMed

Publication types

LinkOut - more resources