. 2011 Jun;39(6):992-9.
doi: 10.1124/dmd.110.037507. Epub 2011 Mar 23.

Alteration of hepatic but not renal transporter expression in diet-induced obese mice

Affiliations

Alteration of hepatic but not renal transporter expression in diet-induced obese mice

Vijay R More et al. Drug Metab Dispos. 2011 Jun.

Abstract

Drug pharmacokinetics can be altered in obese and diabetic subjects. In consideration of the prevalence of obesity and diabetes, characterization of transporter expression in mouse models of diabetes and obesity may be a useful tool to aid in prediction of altered drug pharmacokinetics or adverse drug reactions. It has been reported that ob/ob mice, which display a severe obesity and diabetes phenotype, exhibit multiple changes in drug transporter expression in liver and kidney. In the present study, the mRNA and protein expression of major drug transporters was determined in livers and kidneys of diet-induced obese (DIO) C57BL/6J male mice. The mice were fed a high-fat diet (HFD) (60% fat) from 6 weeks of age and display obesity, fatty liver, and mild hyperglycemia. The HFD diet increased expression of multidrug resistance-associated proteins Abcc3 and 4 mRNA and protein in liver by 3.4- and 1.4-fold, respectively, compared with that detected in control mice fed a low-fat diet (LFD). In contrast, Abcc1 mRNA and protein decreased by 50% in livers of DIO mice compared with those in livers to lean mice. The HFD did not alter transporter expression in kidney compared with the LFD. In summary, unlike ob/ob and db/db mice, DIO mice exhibited a selective induction of efflux transporter expression in liver (i.e., Abcc3 and 4). In addition, diet-induced obesity affects transporter expression in liver but not kidney in the C57BL/6J mouse model. These data indicate that hepatic transporter expression is only slightly altered in a model of mild diabetes and nonalcoholic fatty liver disease and obesity.


Figures

Fig. 1.
Fig. 1.
Representative hematoxylin and eosin staining of liver sections from lean control and DIO mice. A small piece of liver from the central lobe was fixed, prepared for typical paraffin embedding, sectioned to 5 μM, and then stained with hematoxylin and eosin. It was observed that fat depositions were greater in liver sections from DIO mice than in those from lean mice. Original magnification, 200×.
Fig. 2.
Fig. 2.
Uptake transporter organic anion-transporting polypeptide Slco1a1, 1a4, and 2b1 expression in livers of lean control and DIO mice (n = 8). A, mRNA expression for Slco1a1, 1a4, and 2b1. Total RNA was isolated from mouse livers, and mRNA was quantified using a branched DNA signal amplification assay. The data are plotted as average relative light units (RLU) per 10 μg of total RNA ± S.E.M. *, statistically significant difference in expression between DIO mice and lean control mice (p ≤ 0.05). B, protein identification and quantification by Western blotting for Slco1a1, 1a4, and 2b1 in crude membrane fractions in livers of DIO and lean mice. Proteins (50 μg/lane) were isolated by electrophoresis on 4 to 20% acrylamide/bis gels, transblotted on a PVDF membrane, incubated with primary and secondary antibodies and substrate, and detected by chemiluminescence. C, quantification of Western blots with Quantity One software. The average band intensity for lean mice was considered to be 100%, and band intensity in the other group was compared with it to plot the graphs. *, statistically significant difference in band intensity average compared with that of lean mice (p ≤ 0.05). Slco1a4 mRNA expression was up-regulated in DIO mice compared with that in lean mice; however, protein levels remained unchanged for Slco1a4 and 1b2. Slco1a1 protein levels were significantly down-regulated in livers of DIO mice compared with those in lean mice. Gapdh, glyceraldehyde-3-phosphate dehydrogenase.
Fig. 3.
Fig. 3.
Basolateral efflux transporters multidrug resistance-associated protein Abcc1, 3, 4, 5, and 6 expression in livers of lean control and DIO mice. A, mRNA expression for Abcc1, 3, 4, 5, and 6. Total RNA was isolated from mouse livers, and mRNA was quantified using a branched DNA signal amplification assay. The data are plotted as average relative light units (RLU) per 10 μg of total RNA ± S.E.M. *, statistically significant difference of expression between control and DIO mice (p ≤ 0.05). B, protein identification and quantification by Western blotting for Abcc1, 3, 4, and 6 in the crude membrane fractions from livers of DIO and lean mice. Proteins (50 μg/lane) were isolated by electrophoresis on 10% acrylamide/bis gels, transblotted, incubated with primary and secondary antibodies and substrate, and detected by chemiluminescence. C, quantification of Western blots with Quantity One software. The average band intensity for lean mice was considered to be 100%, and band intensity in the other group was compared with it to plot the graphs. *, statistically significant difference between band intensity average compared with that of control mice (p ≤ 0.05). mRNA expression for Abcc1, 4, 5, and 6 remained unchanged, whereas Abcc3 expression was up-regulated in DIO mice compared with that in lean mice. Abcc3 and 4 protein expression was up-regulated, whereas abcc1 was down-regulated in livers of DIO mice compared with that in livers of lean controls. Gapdh, glyceraldehyde-3-phosphate dehydrogenase.
Fig. 4.
Fig. 4.
Canalicular efflux transporters multidrug resistance-associated protein Abcc2 and breast cancer resistance protein Abcg2 expression in livers of lean control and DIO mice. A, mRNA expression for Abcc2 and Abcg2. Total RNA was isolated from mouse livers, and mRNA was quantified using a branched DNA signal amplification assay. The data are plotted as average relative light units (RLU) per 10 μg of total RNA ± S.E.M. *, statistically significant difference of expression between lean control and DIO mice (p ≤ 0.05). B, protein identification and quantification by Western blotting for Abcc2 and Abcg2 in the crude membrane fraction from livers of lean control and DIO mice. The proteins were isolated by electrophoresis on 10% acrylamide/bis gels, transblotted, incubated with primary and secondary antibodies and substrate, and detected by chemiluminescence. C, quantification of Western blots with Quantity One software. The average band intensity for lean mice was considered to be 100%, and band intensity in the other groups were compared with it to plot the graphs. *, statistically significant difference between band intensity average compared with that of lean control mice (p ≤ 0.05). Abcc2 mRNA remained unchanged, but protein expression was up-regulated, whereas for Abcg2, both mRNA and protein expression was up-regulated in livers of DIO mice compared with that in livers of lean mice. Gapdh, glyceraldehyde-3-phosphate dehydrogenase.
Fig. 5.
Fig. 5.
Uptake transporters Slco1a1 and 1a6, Oat1 and 2, and Oct1 and 2 expression in kidneys of lean control and DIO mice. A, mRNA expression for uptake transporters organic anion-transporting polypeptide Slco1a1 and 1a6 and organic anion and cation transporters Oat1 and 2 and Oct1 and 2 in kidneys of lean control and DIO mice. Total RNA was isolated from kidneys of mice by phenol chloroform extraction, and mRNA was quantified using a branched DNA signal amplification assay. The data are plotted as average relative light units (RLU) per 10 μg of total RNA ± S.E.M. B, protein identification and quantification by Western blotting for Slco1a1 in the crude membrane fraction from kidneys of lean control and DIO mice. The proteins were isolated by electrophoresis on 10% acrylamide/bis gels, transblotted, incubated with primary and secondary antibodies and substrate, and detected by chemiluminescence. C, quantification of Western blots with Quantity One software. The average band intensity for lean mice was considered to be 100%, and band intensities in the other groups were compared with it to plot the graphs. *, statistically significant difference of expression between lean control and DIO mice (p ≤ 0.05). Only Oat2 mRNA expression was down-regulated in DIO mice; Slco1a1 and 1a6, Oat1, and Oct1 and 2 mRNA remained unchanged compared with that in lean mice. Slco1a1 protein expression also remained unchanged. Gapdh, glyceraldehyde-3-phosphate dehydrogenase.
Fig. 6.
Fig. 6.
Efflux transporter expression in kidneys of lean control and DIO mice. A, mRNA expression for efflux transporters multidrug resistance-associated protein Abcc1, 2, 3, and 4 in kidneys of lean control and DIO mice. Total RNA was isolated from mouse kidneys, and mRNA was quantified using a branched DNA signal amplification assay. The data are plotted as average relative light units (RLU) per 10 μg of total RNA ± S.E.M. B, protein identification and quantification by Western blotting for Abcc2 and 4 in the crude membrane fraction from kidneys of lean control and DIO mice. The proteins were isolated by electrophoresis on 10% acrylamide/bis gels, transblotted, incubated with primary and secondary antibodies and substrate, and detected by chemiluminescence. C, quantification of Western blots with Quantity One software. The average band intensity for lean mice was considered to be 100%, and band intensities in the other groups were compared with it to plot the graphs. *, statistically significant difference of expression between lean control and DIO mice (p ≤ 0.05). Abcc1, 2, 3, and 4 mRNA, as well as Abcc2 and 4 protein expression remained unchanged in kidneys of DIO mice. Gapdh, glyceraldehyde-3-phosphate dehydrogenase.
Fig. 7.
Fig. 7.
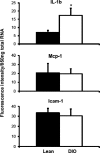
mRNA expression of proinflammatory cytokines interleukin (IL)-1β, Mcp-1, and Icam-1 in livers of lean and DIO mice. Total RNA was isolated from liver tissues and quantified by the QuantiGene Plex 2.0 assay for cytokines. Data are plotted as average fluorescence intensity per 850 ng of total RNA. *, statistically significant difference of expression between lean control and DIO mice (p ≤ 0.05). IL-1β mRNA expression was up-regulated in DIO mice compared with that in lean mice. Mcp-1 and Icam-1 remained unchanged.
Fig. 8.
Fig. 8.
Protein expression of efflux transporters ABCC2, 3, and 4 in steatotic and nonsteatotic human liver tissues. Human liver tissues were obtained from the Liver Tissue Cell Distribution System. A, protein expression by Western blotting. The membrane fractions were isolated from these tissues and subjected to SDS-polyacrylamide gel electrophoresis, followed by transfer to a PVDF membrane and incubations with primary and secondary antibodies. B, quantification of Western blots. The Western blots were quantified by Quantity One software. It was observed that steatosis significantly up-regulated ABCC4 protein expression. ABCC2 protein levels remained unchanged. ABCC3 also showed an increasing trend, but the blot was not quantified, as some bands were not detectable by software.

Similar articles

Cited by

References

    1. Abernethy DR, Greenblatt DJ, Locniskar A, Ochs HR, Harmatz JS, Shader RI. (1986) Obesity effects on nitrazepam disposition. Br J Clin Pharmacol 22:551–557 - PMC - PubMed
    1. Aleksunes LM, Slitt AM, Cherrington NJ, Thibodeau MS, Klaassen CD, Manautou JE. (2005) Differential expression of mouse hepatic transporter genes in response to acetaminophen and carbon tetrachloride. Toxicol Sci 83:44–52 - PubMed
    1. Bergman SJ, Speil C, Short M, Koirala J. (2007) Pharmacokinetic and pharmacodynamic aspects of antibiotic use in high-risk populations. Infect Dis Clin North Am 21:821–846, x - PubMed
    1. Buist SC, Klaassen CD. (2004) Rat and mouse differences in gender-predominant expression of organic anion transporter (Oat1–3; Slc22a6–8) mRNA levels. Drug Metab Dispos 32:620–625 - PubMed
    1. Bush EN, Shapiro R, Nuss M, Kaszubska W, Trevillyan J, Knourek-Segel V, Kennedy M, Adler A, Jirousek M, Jacobson P. (2001) Adiposity, leptin resistance, hyperrphagia, hyperglycemia, glucose intolerance and insulin resistance in C57BL/6J mice fed high fat diets, in Proceedings of the 83rd Annual Meeting and Expo of the Endocrine Society; 2001 Jun 20–23; Denver, CO The Endocrine Society, Chevy Chase, MD

Publication types