Case Reports
. 2011 Sep;69(3):668-76.
doi: 10.1227/NEU.0b013e3182181ba8.

Colocalization of gadolinium-diethylene triamine pentaacetic acid with high-molecular-weight molecules after intracerebral convection-enhanced delivery in humans

Affiliations
Case Reports

Colocalization of gadolinium-diethylene triamine pentaacetic acid with high-molecular-weight molecules after intracerebral convection-enhanced delivery in humans

John H Sampson et al. Neurosurgery. 2011 Sep.

Abstract

Background: Convection-enhanced delivery (CED) permits site-specific therapeutic drug delivery within interstitial spaces at increased dosages through circumvention of the blood-brain barrier. CED is currently limited by suboptimal methodologies for monitoring the delivery of therapeutic agents that would permit technical optimization and enhanced therapeutic efficacy.

Objective: To determine whether a readily available small-molecule MRI contrast agent, gadolinium-diethylene triamine pentaacetic acid (Gd-DTPA), could effectively track the distribution of larger therapeutic agents.

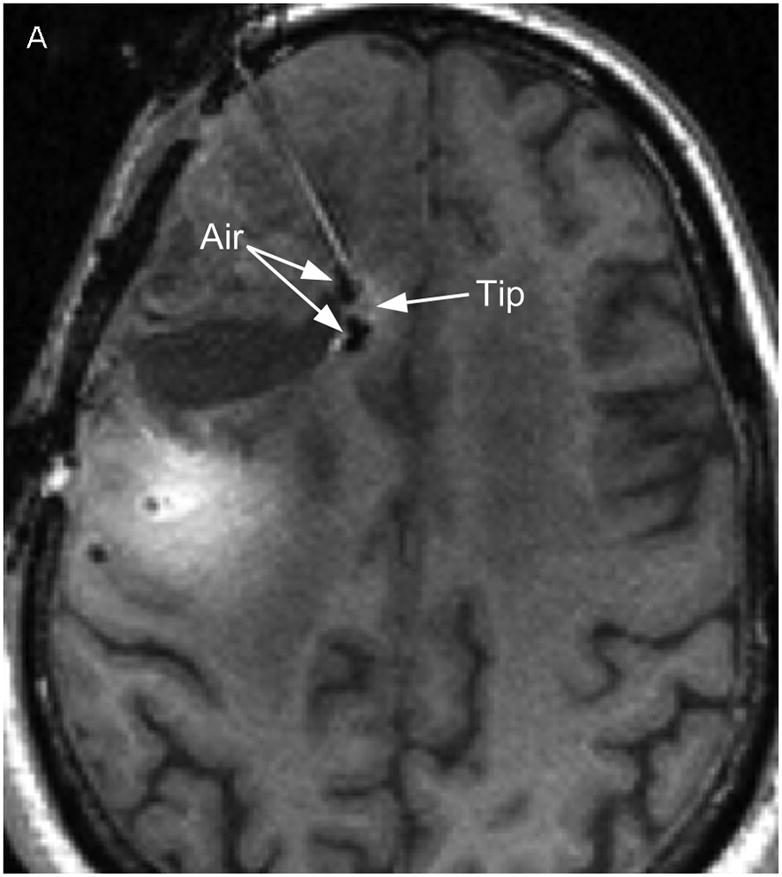
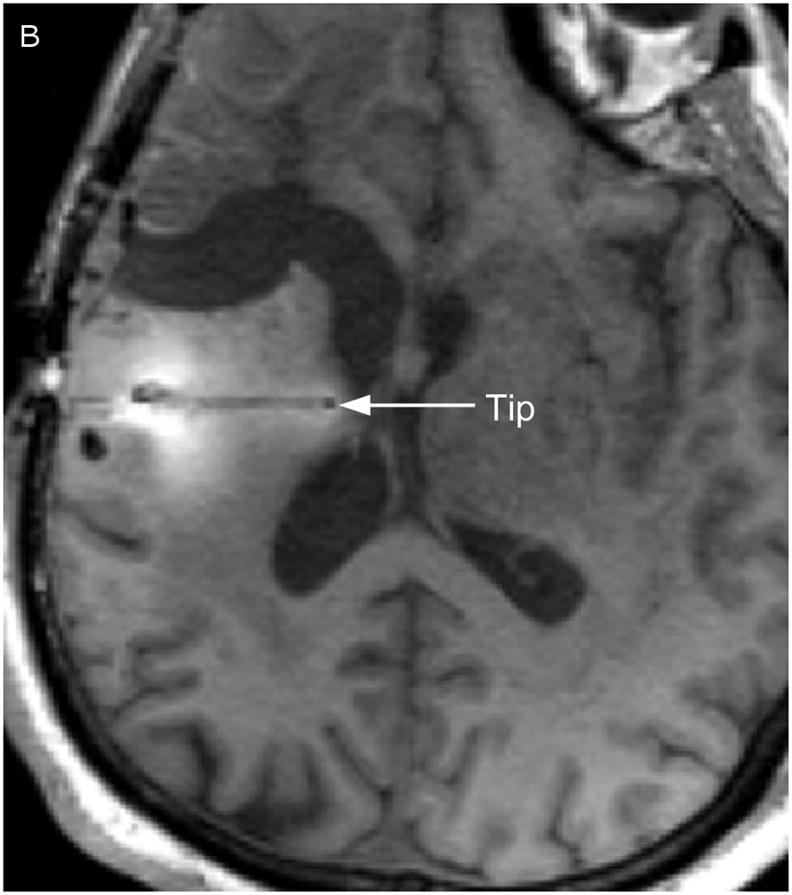
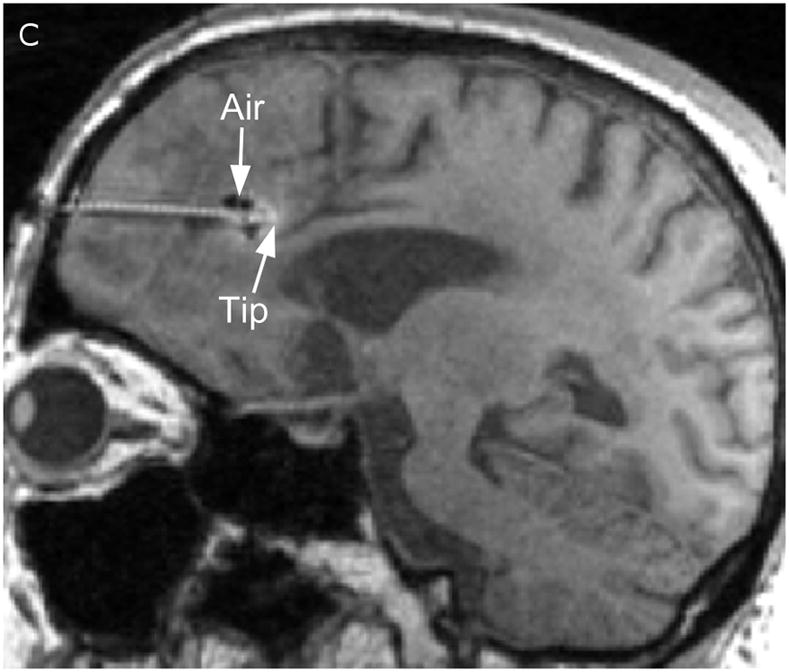
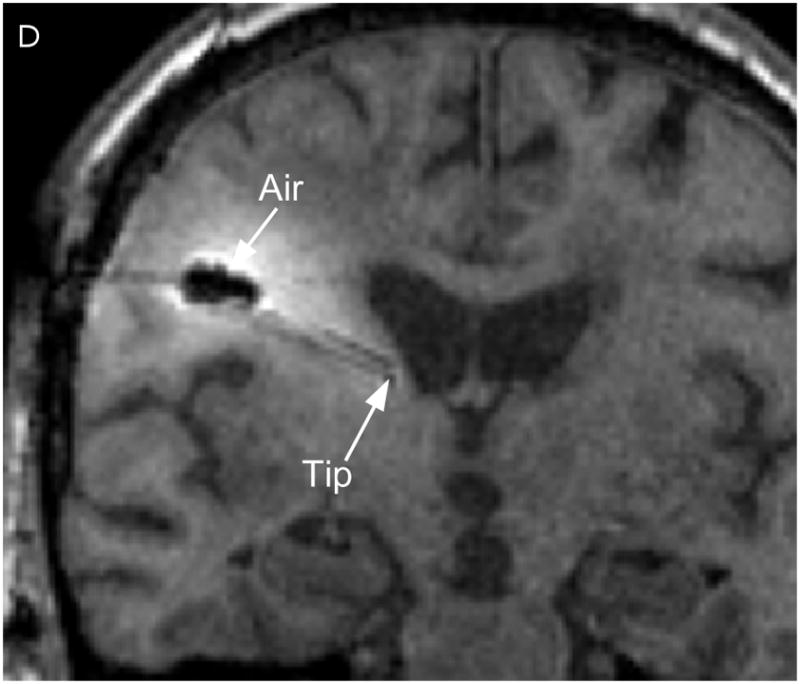
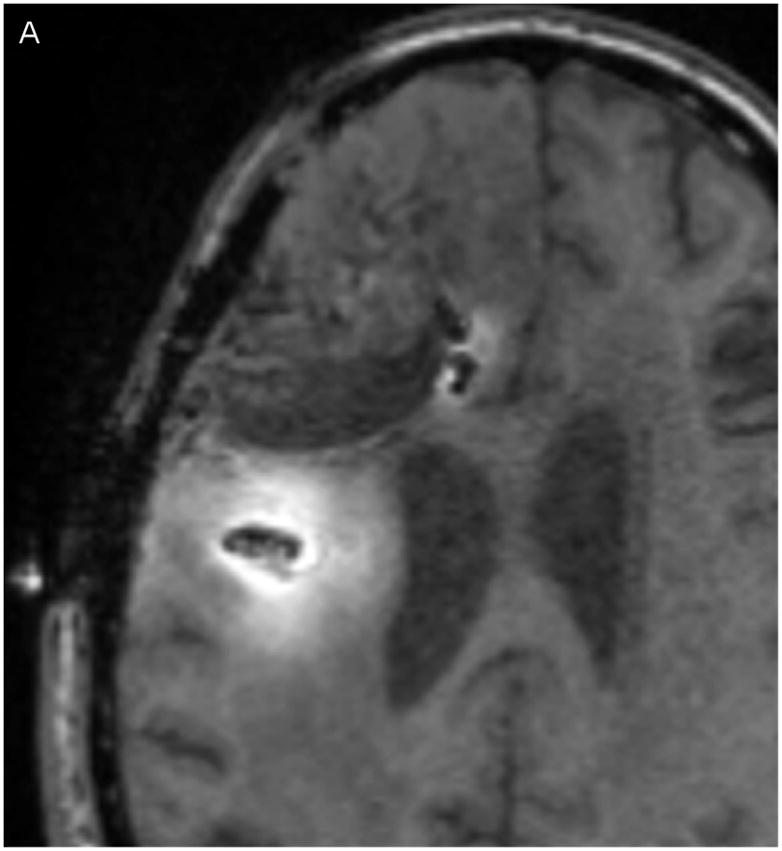
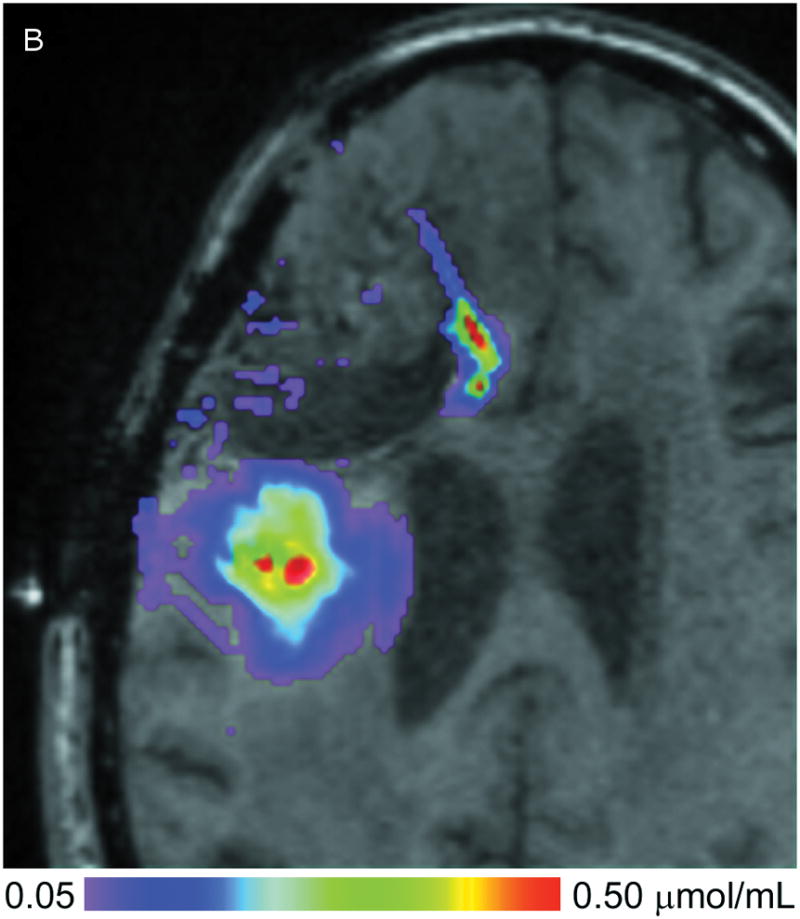
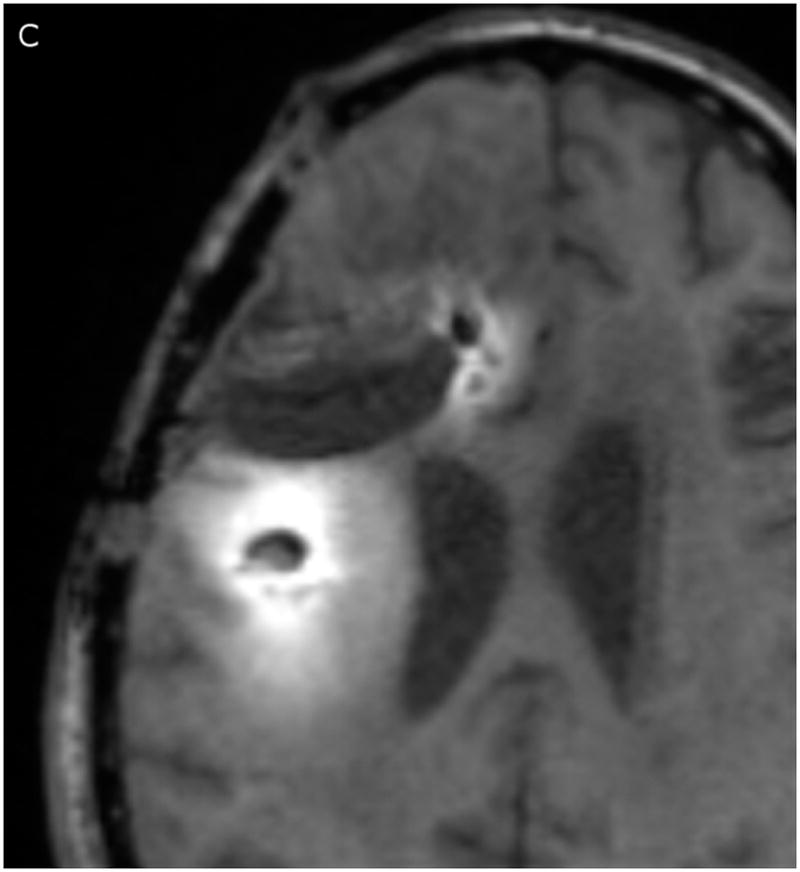
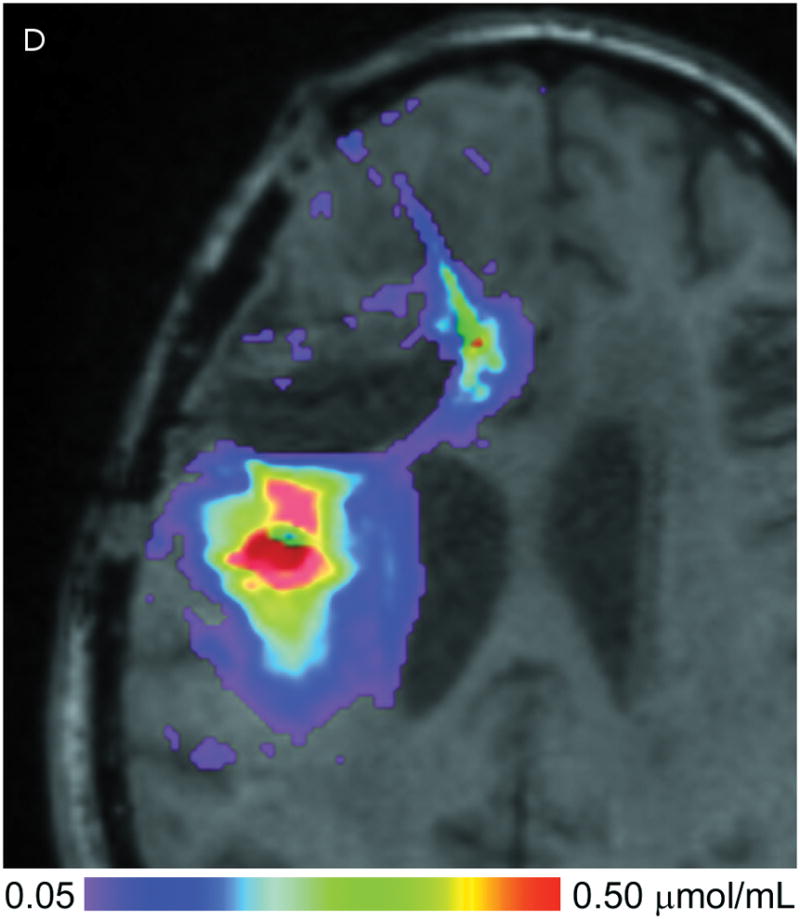
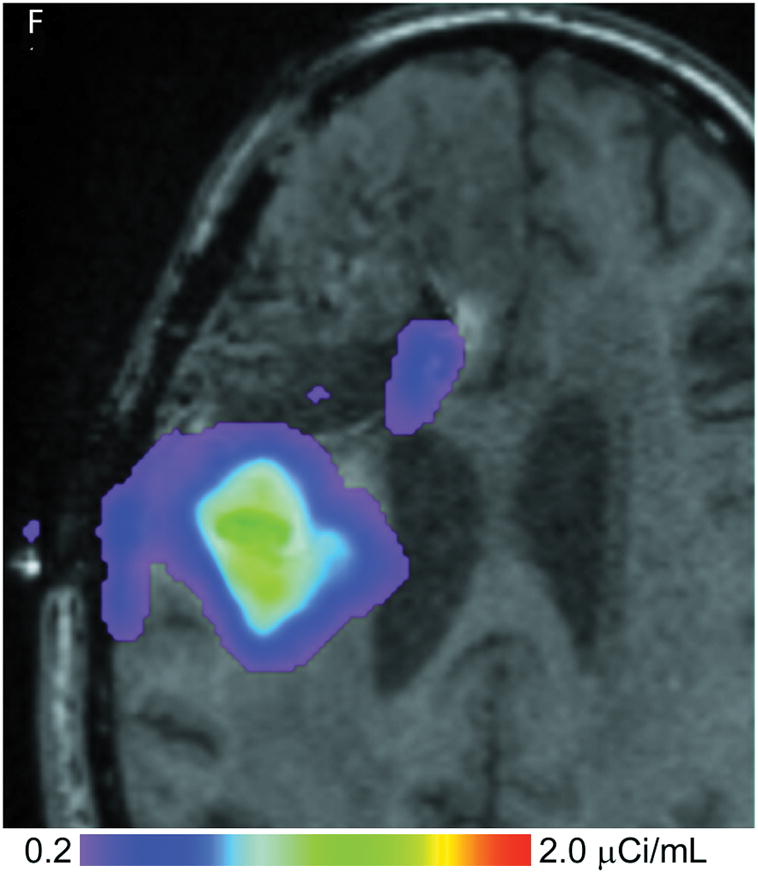
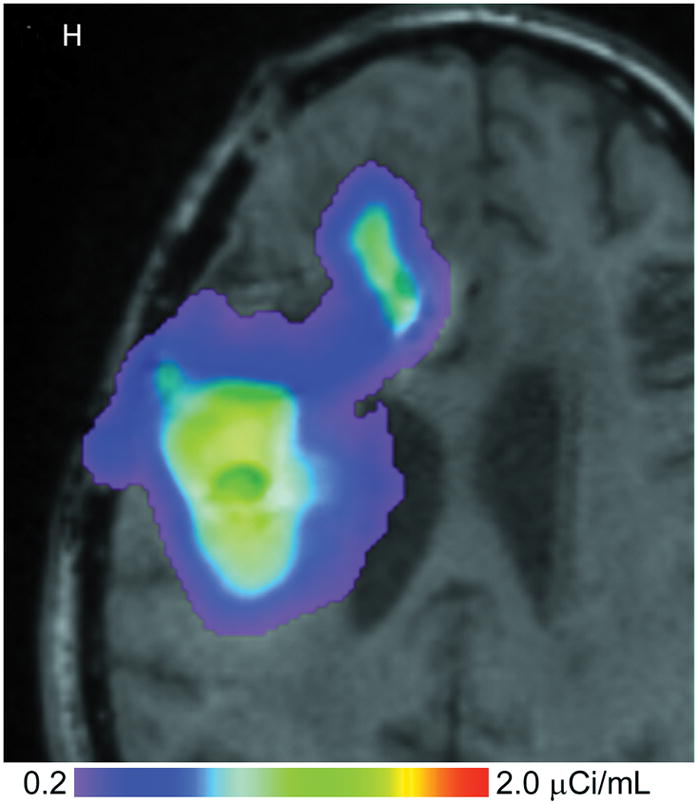
Methods: Gd-DTPA was coinfused with the larger molecular tracer, I-labeled human serum albumin (I-HSA), during CED of an EGFRvIII-specific immunotoxin as part of treatment for a patient with glioblastoma.

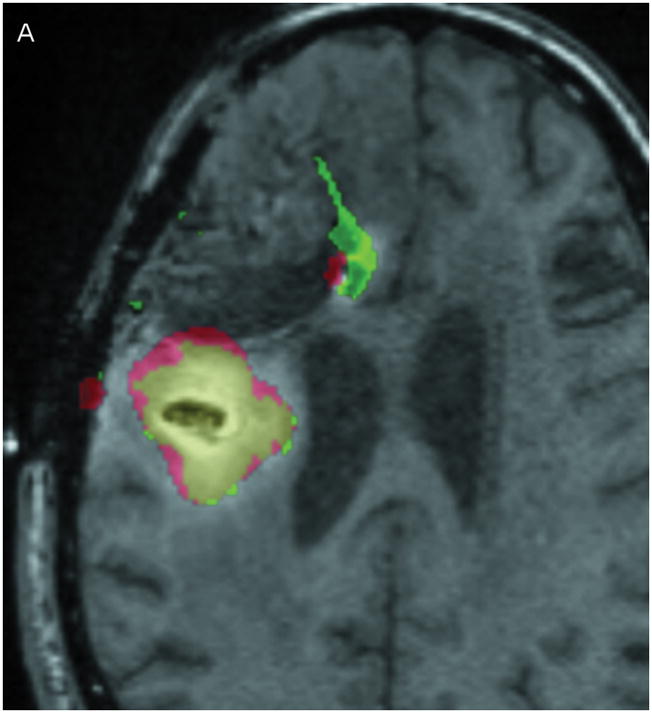
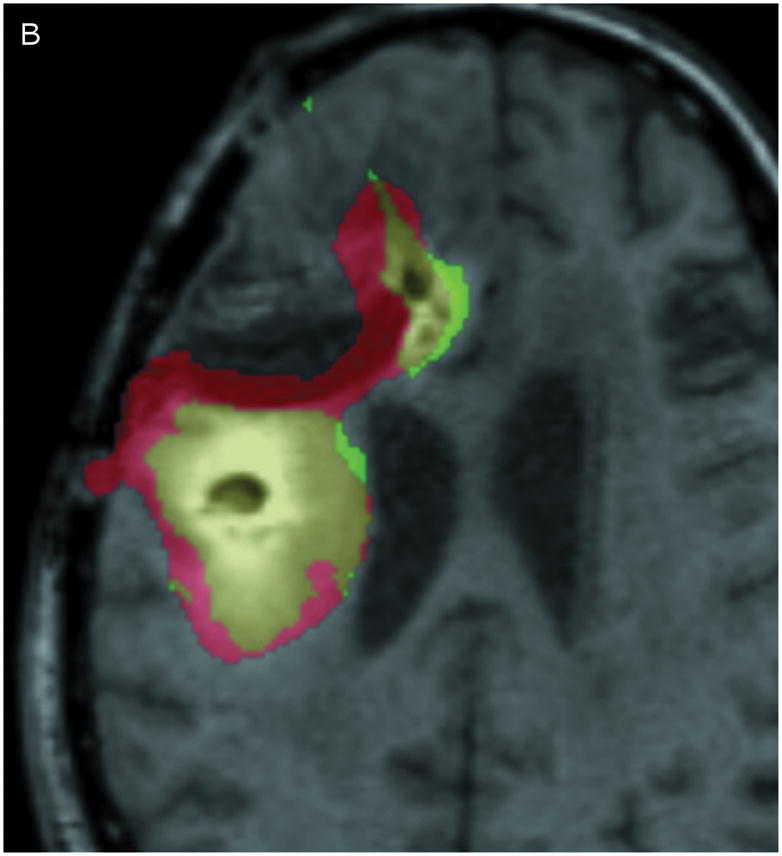
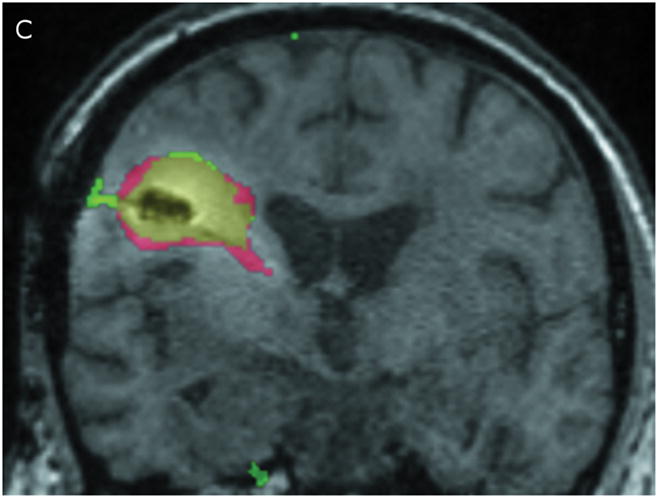
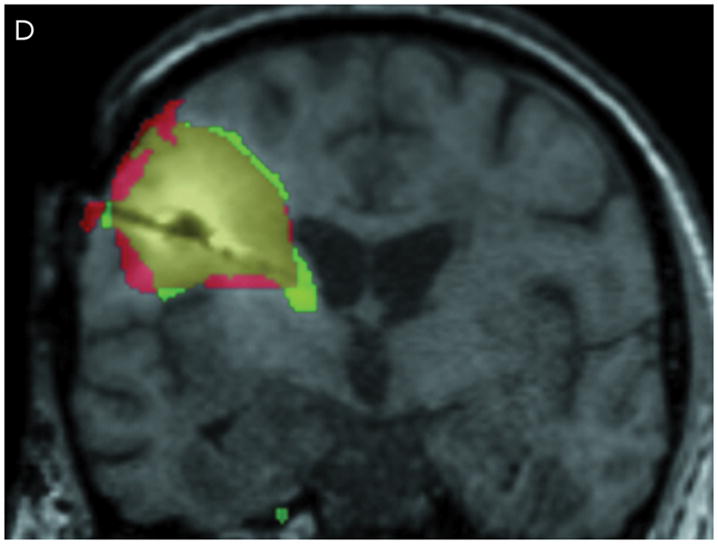
Results: Infusion of both tracers was safe in this patient. Analysis of both Gd-DTPA and I-HSA during and after infusion revealed a high degree of anatomical and volumetric overlap.

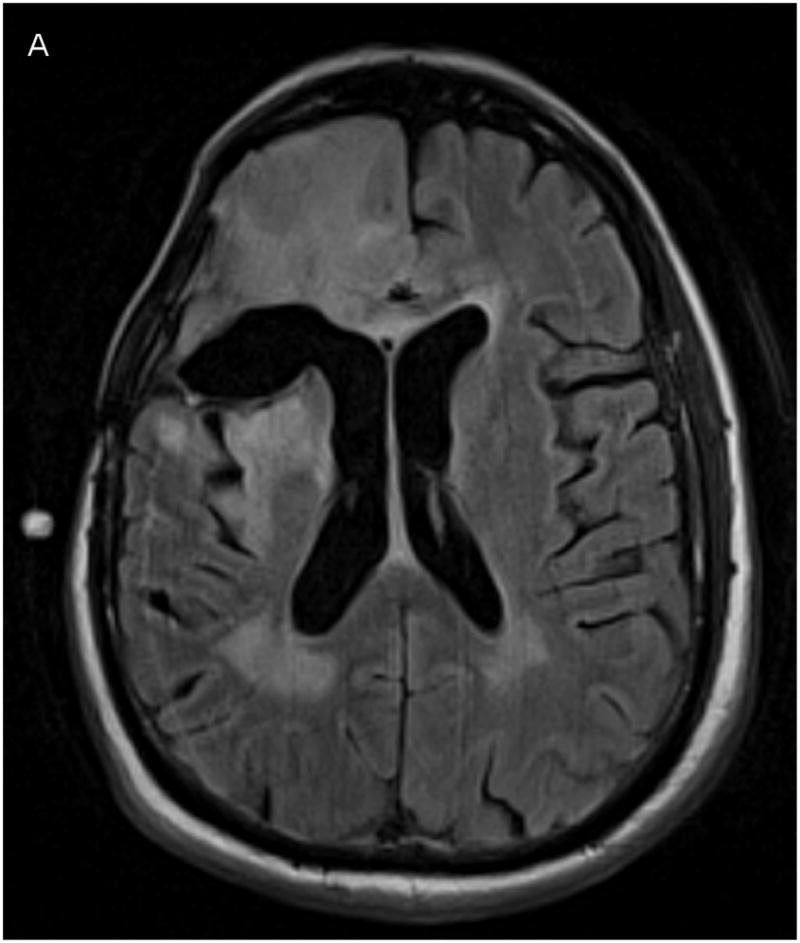
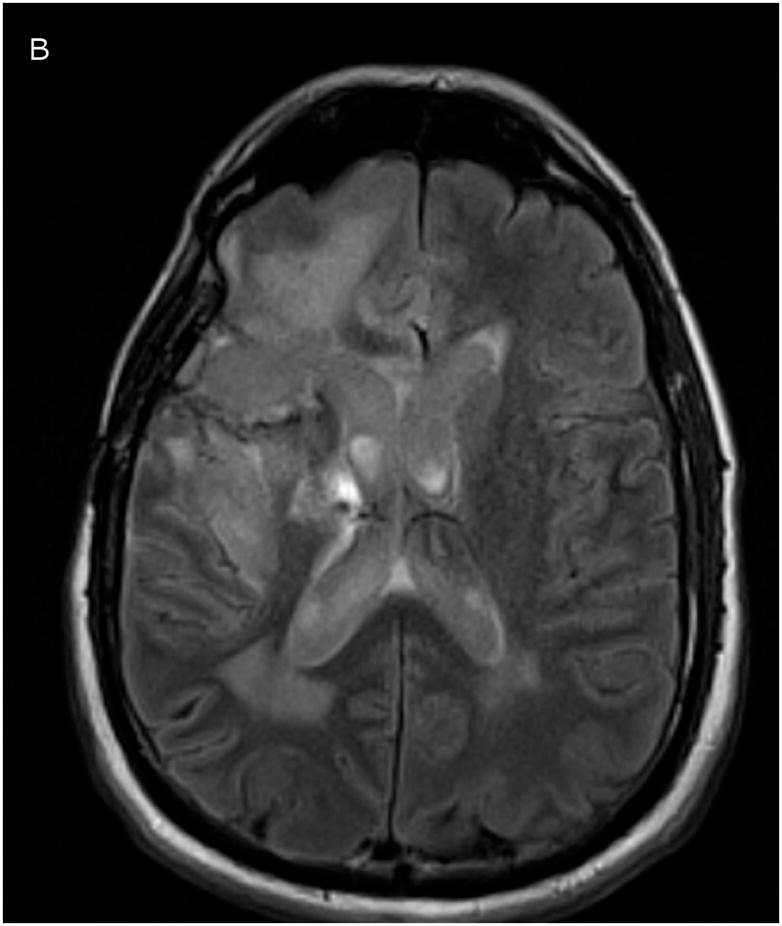
Conclusion: Gd-DTPA may be able to accurately demonstrate the anatomic and volumetric distribution of large molecules used for antitumor therapy with high resolution and in combination with fluid-attenuated inversion recovery (FLAIR) imaging, and provide additional information about leaks into cerebrospinal fluid spaces and resection cavities. Similar studies should be performed in additional patients to validate our findings and help refine the methodologies we used.


Figures

Figure 1
Figure 1
Catheter locations. A T1-weighted MRI acquisition after 24 hours of infusion was re-sliced obliquely to show the full catheter extent in two perpendicular planes. The anterior catheter is shown in two views on the left panels (A & C), and the posterior catheter in two planes on the right panels (B & D).
Figure 1
Figure 1
Catheter locations. A T1-weighted MRI acquisition after 24 hours of infusion was re-sliced obliquely to show the full catheter extent in two perpendicular planes. The anterior catheter is shown in two views on the left panels (A & C), and the posterior catheter in two planes on the right panels (B & D).
Figure 2
Figure 2
(A–D) T1-weighted MRI signal (left panels) compared to measured Gd-DTPA concentration profile (right panels). (E–H) T1-weighted MRI signal (left panels) with overlaid 124I-HSAconcentration (right panels). (A) T1-weighted signal at 24 hours, (B) Gd concentration at 24 hours, (C) T1-weighted signal at 72 hours, (D) Gd concentration at 72 hours. (E) T1-weighted signal at 24 hours, (F) 124I-HSA activity at 24 hours, (G) T1-weighted signal at 72 hours, (H) 124I-HSA activity at 72 hours.
Figure 2
Figure 2
(A–D) T1-weighted MRI signal (left panels) compared to measured Gd-DTPA concentration profile (right panels). (E–H) T1-weighted MRI signal (left panels) with overlaid 124I-HSAconcentration (right panels). (A) T1-weighted signal at 24 hours, (B) Gd concentration at 24 hours, (C) T1-weighted signal at 72 hours, (D) Gd concentration at 72 hours. (E) T1-weighted signal at 24 hours, (F) 124I-HSA activity at 24 hours, (G) T1-weighted signal at 72 hours, (H) 124I-HSA activity at 72 hours.
Figure 3
Figure 3
Comparison of Gd-DTPA and 124I-HSAdistribution at 10% of infused concentration. (A & B) Axial images at 24 and 72 hours respectively. (C & D) Coronal images at 24 and 72 hours respectively. Green: Gd-DTPA 10% isodose (0.1 μmol/mL), Red: 124I-HSA10% isodose (0.4 μCi/mL), Yellow: Overlap between the 10% Gd-DTPA and 124I-HSAregions.
Figure 3
Figure 3
Comparison of Gd-DTPA and 124I-HSAdistribution at 10% of infused concentration. (A & B) Axial images at 24 and 72 hours respectively. (C & D) Coronal images at 24 and 72 hours respectively. Green: Gd-DTPA 10% isodose (0.1 μmol/mL), Red: 124I-HSA10% isodose (0.4 μCi/mL), Yellow: Overlap between the 10% Gd-DTPA and 124I-HSAregions.
Figure 4
Figure 4
Co-registered FLAIR imaging, taken prior to catheter placement (A, baseline) and after 1 day of infusion (B, 24 hours). Signal increase due to Gd-DTPA presence appears in ventricles, resection cavity, and subarachnoid space.
Figure 4
Figure 4
Co-registered FLAIR imaging, taken prior to catheter placement (A, baseline) and after 1 day of infusion (B, 24 hours). Signal increase due to Gd-DTPA presence appears in ventricles, resection cavity, and subarachnoid space.

Similar articles

Cited by

References

    1. Bobo RH, Laske DW, Akbasak A, Morrison PF, Dedrick RL, Oldfield EH. Convection-enhanced delivery of macromolecules in the brain. Proc Natl Acad Sci U S A. 1994 Mar 15;91(6):2076–2080. - PMC - PubMed
    1. Grossi PM, Ochiai H, Archer GE, et al. Efficacy of intracerebral microinfusion of trastuzumab in an athymic rat model of intracerebral metastatic breast cancer. Clin Cancer Res. 2003 Nov 15;9(15):5514–5520. - PubMed
    1. Heimberger AB, Archer GE, McLendon RE, et al. Temozolomide delivered by intracerebral microinfusion is safe and efficacious against malignant gliomas in rats. Clin Cancer Res. 2000 Oct;6(10):4148–4153. - PubMed
    1. Kunwar S, Chang S, Westphal M, et al. Phase III randomized trial of CED of IL13-PE38QQR vs Gliadel wafers for recurrent glioblastoma. Neuro Oncol. 2010 Feb 4; - PMC - PubMed
    1. Gill SS, Patel NK, Hotton GR, et al. Direct brain infusion of glial cell line-derived neurotrophic factor in Parkinson disease. Nat Med. 2003 May;9(5):589–595. - PubMed

Publication types

MeSH terms