. 2011 Jun;79(11):1207-16.
doi: 10.1038/ki.2010.532. Epub 2011 Mar 23.

Hexokinase regulates Bax-mediated mitochondrial membrane injury following ischemic stress

Affiliations

Hexokinase regulates Bax-mediated mitochondrial membrane injury following ischemic stress

Jonathan M Gall et al. Kidney Int. 2011 Jun.

Abstract

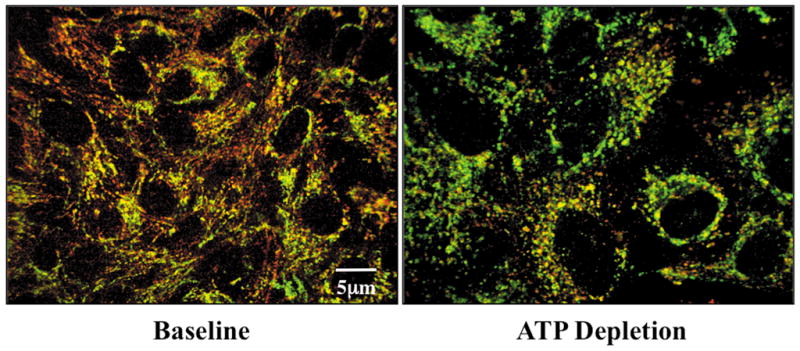
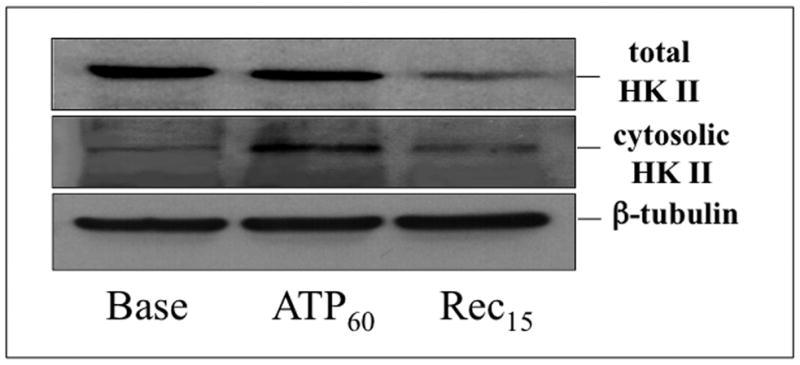
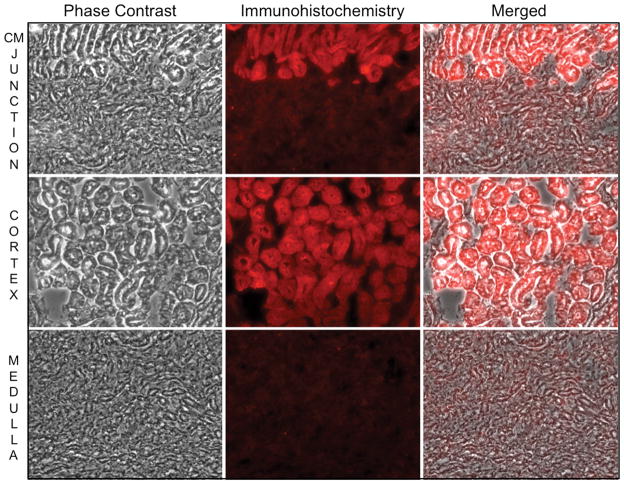
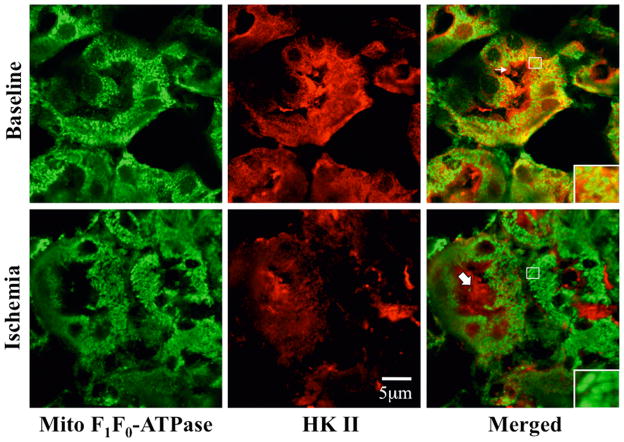
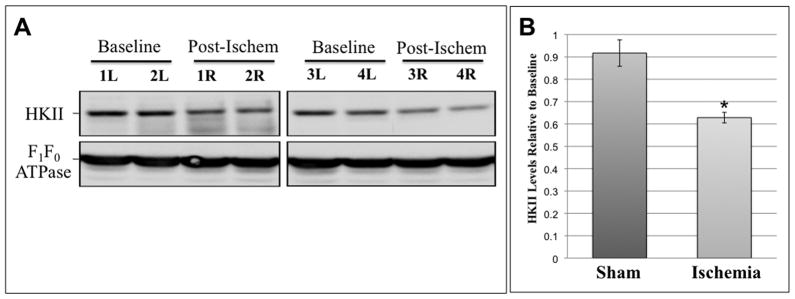
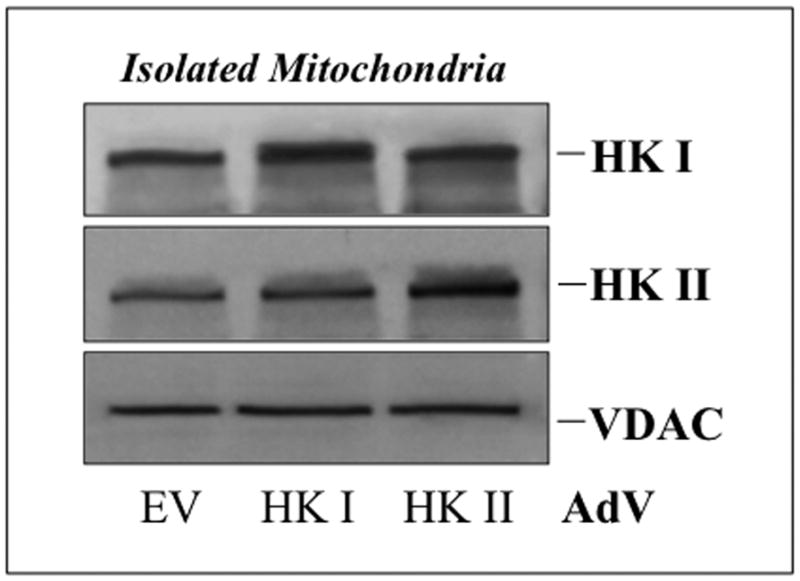
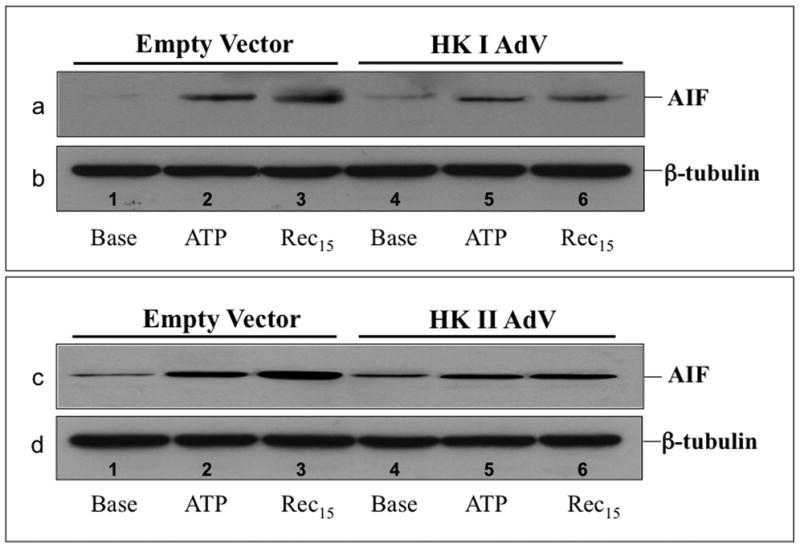
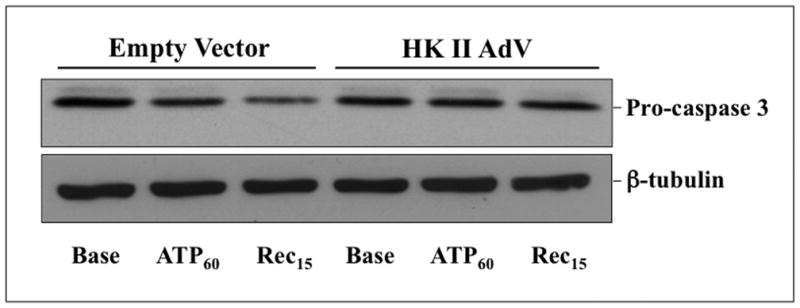
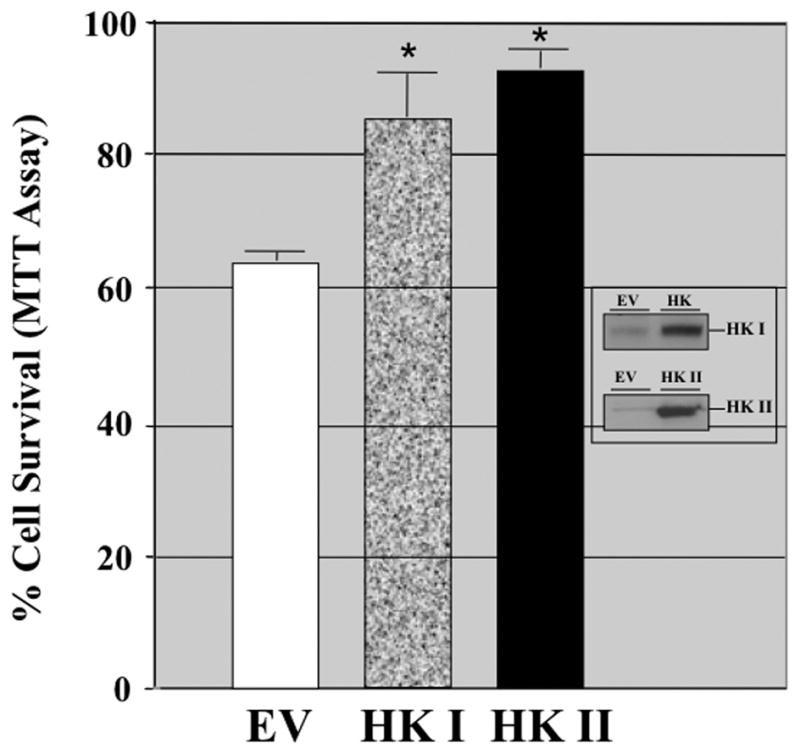
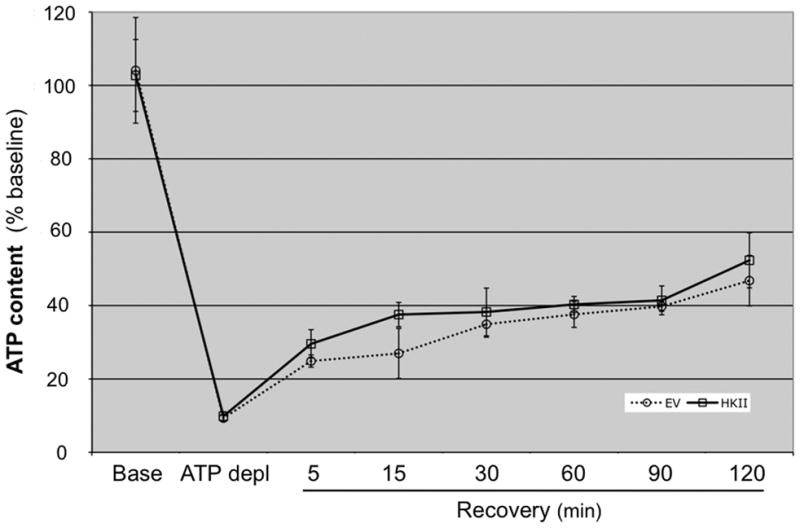
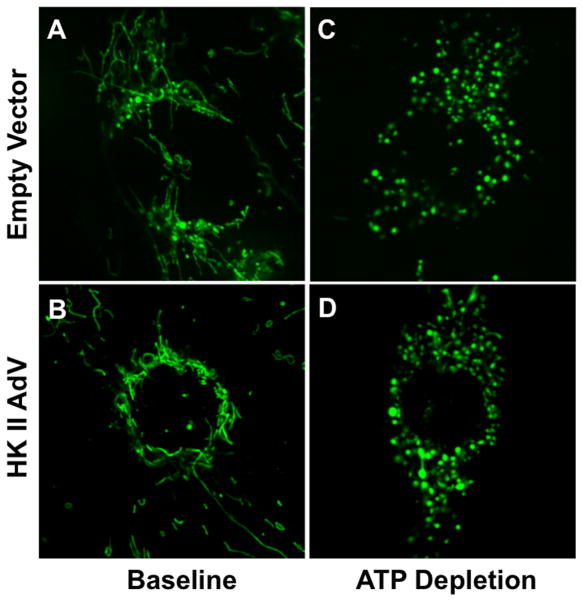
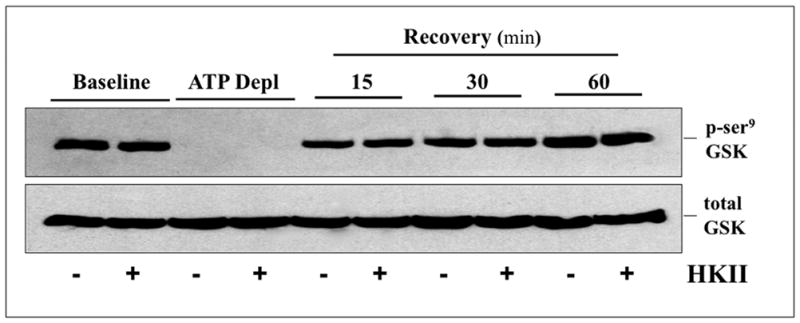
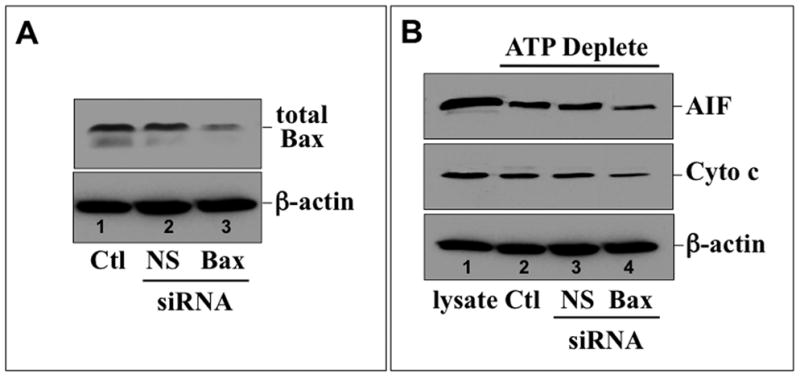
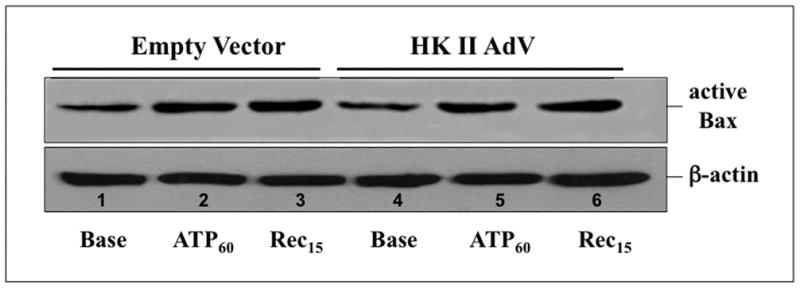
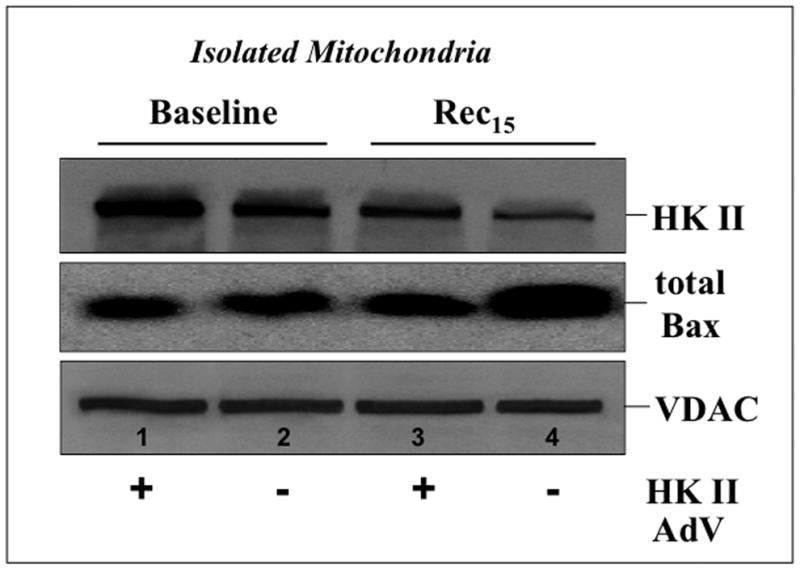
Hexokinase (HK), the rate-limiting enzyme in glycolysis, controls cell survival by promoting metabolism and/or inhibiting apoptosis. Since HK isoforms I and II have mitochondrial targeting sequences, we attempted to separate the protective effects of HK on cell metabolism from those on apoptosis. We exposed renal epithelial cells to metabolic stress causing ATP depletion in the absence of glucose and found that this activated glycogen synthase kinase 3β (GSK3β) and Bax caused mitochondrial membrane injury and apoptosis. ATP depletion led to a progressive HK II dissociation from mitochondria, released mitochondrial apoptosis inducing factor and cytochrome c into the cytosol, activated caspase-3, and reduced cell survival. Compared with control, adenoviral-mediated HK I or II overexpression improved cell survival following stress, but did not prevent GSK3β or Bax activation, improve ATP content, or reduce mitochondrial fragmentation. HK I or HK II overexpression increased mitochondria-associated isoform-specific HK content, and decreased mitochondrial membrane injury and apoptosis after stress. In vivo, HK II localized exclusively to the proximal tubule. Ischemia reduced total renal HK II content and dissociated HK II from proximal tubule mitochondria. In cells overexpressing HK II, Bax and HK II did not interact before or after stress. While the mechanism by which HK antagonizes Bax-mediated apoptosis is unresolved by these studies, one possible scenario is that the two proteins compete for a common binding site on the outer mitochondrial membrane.


Conflict of interest statement

DISCLOSURE

The authors have no competing financial interests.

Figures

Fig 1
Fig 1. Metabolic stress causes HK II to dissociate from mitochondria
HK II (red) and Cox IV (green), an outer mitochondrial membrane protein, by immunofluorescence at baseline and following 15 min recovery from 60 min ATP depletion.
Fig 2
Fig 2. Effect of metabolic stress on cell HK II distribution
Total (upper panel) and cytosolic (middle panel) HK II content assessed by immunoblot analysis in cell lysates and in soluble extracts of digitonin-treated cells respectively, at baseline (Base), after 60 min ATP depletion (ATP60), and 15 min recovery (Rec15); β-tubulin serves as a loading control (lower panel).
Fig 3
Fig 3. Effect of renal ischemia in vivo on mitochondrial-associated HK II
(A) Phase contrast, HK II immunofluorescence (red), and merged images of the corticomedullary region (“CM junction”; upper panels); renal cortex (middle panels) and medulla (lower panels) of normal murine renal tissue. HK II localizes to the proximal tubule; (B) HK II (red) partially co-localizes with mitochondrial F1F0 ATPase (green) at baseline as indicated by orange-yellow staining (right upper panel); HK II dissociates from mitochondrial after 40 min renal artery occlusion as shown by separation of the red and green signals (right lower panels); original magnification 630x. Arrow indicates brush border with prominent HK II staining. Solid arrow shows HK II in the lumen of a proximal tubule. Inset shows mitochondrial staining at higher magnification to show differences in mitochondrial HK II before vs. after renal ischemia. These images are representative of at least three separate studies.
Fig 4
Fig 4. Renal ischemia in vivo alters HK II
(A) Effect of 40 min unilateral renal artery occlusion on HK II content in renal homogenates (‘R’ or right kidney) compared to baseline (‘L’ or left kidney) in four representative animals; mitochondrial F1F0 ATPase, serves as loading control; (B) densitometric analysis of HK II in unilateral sham ischemia (n=6) vs. unilateral renal ischemia; n=6; P < 0.05 vs. baseline or sham.
Fig 5
Fig 5. Effect of HK I or II over-expression on mitochondrial associated HK, organelle injury, caspase 3 activation and cell survival after stress
(A) HK I and HK II content in isolated mitochondria harvested from cells that express either HK I HK II or empty vector (EV); (B) mitochondrial membrane injury assessed by leakage of apoptosis inducing factor (AIF) into the cytosol of digitonin-permeabilized cells (upper panel) at baseline (Base), after 60 min ATP depletion (ATP60), and following 15 min recovery (Rec15) in empty vector vs. HK I (panel a) or II (panel c) over-expressing cells (HK I or II AdV); β-tubulin loading control (lower panel); (C) content of pro-caspase 3, the inactive form of the apoptotic enzyme at baseline (Base), after 60 min ATP depletion (ATP60), and following 15 min recovery (Rec15) in HK II over-expressing vs. empty vector cells; (D) Survival assessed by the MTT assay in empty vector (EV) vs. HK II over-expressing cells (HK II AdV) after 2 hr ATP depletion followed by 6 hr recovery (Rec6hr); immunoblot analysis confirming HK II over-expression without altering HK I content (inset);
Fig 6
Fig 6. Effect of HK II over-expression on cell ATP content after metabolic stress
Luciferase assay measurements of total ATP content at baseline (Base), after 60 min ATP depletion (ATP Depl), and after 5–120 min recovery (Rec5 - Rec120) in cells treated with either empty vector (EV) or HK II adenovirus (HK II). Data are expressed as mean ± SE; n=6.
Fig 7
Fig 7. Effect of HK II over-expression on mitochondrial morphology
Morphology of mitochondria stained with Mitotracker Green FM at baseline (panels A,B) or after 30 min ATP depletion (panels C,D) in renal cells infected with either control AdV (‘empty vector’) or HK II (‘HK II AdV’).
Fig 8
Fig 8. Effect of HK II over-expression on GSK3β activation after metabolic stress
Inactive (p-ser9) GSK3β content in cell lysates by immunoblot analysis at baseline, after 60 minutes ATP depletion (ATP Depl), and following 15, 30, and 60 min recovery in cells treated with either empty vector (−) or HK II adenovirus (+). Total GSK3β loading control (lower panel).
Fig 9
Fig 9. Bax knockdown prevents mitochondrial leak of pro-apoptotic effector proteins after metabolic stress
(A) Total Bax content (upper panel) in control (Ctl) and cells treated with either non-specific (NS) or Bax-specific (Bax) siRNA by immunoblot; β-actin loading control (lower panel); (B) AIF (upper panel) and cytochrome c (Cyto c, middle panel) measured by immunoblot in the digitonin-permeabilized control (Ctl), or cells exposed to non-specific (NS) or Bax-specific (Bax) siRNA following 60 min ATP depletion; s-actin loading control (lower panel).
Fig 10
Fig 10. Effect of HK II over-expression on stress-induced Bax activation
Active Bax (upper panel) detected by immunoblot with an anti-6A7 epitope-specific antibody in cells exposed to either empty vector (empty vector) or HK II (HK II AdV) adenovirus at baseline (Base), after 60 min ATP depletion (ATP60) and 15 min recovery (Rec15); β-actin loading control (lower panel).
Fig 11
Fig 11. Effect of HK II over-expression on mitochondrial HK II and Bax content
HK II (upper panel) and total Bax (middle panel) assessed in isolated mitochondria harvested from cells exposed to empty vector (−) or HK II (+) containing adenovirus at baseline and 15 min recovery following ATP depletion (Rec15). VDAC, an outer mitochondrial membrane protein, serves as loading control (lower panel).

Comment in

References

    1. Bryson JM, Coy PE, Gottlob K, Hay N, et al. Increased hexokinase activity, of either ectopic or endogenous origin, protects renal epithelial cells against acute oxidant-induced cell death. J Biol Chem. 2002;277:11392–11400. - PubMed
    1. Wilson JE. Isozymes of mammalian hexokinase: structure, subcellular localization and metabolic function. J Exp Biol. 2003;206:2049–2057. - PubMed
    1. Azoulay-Zohar H, Israelson A, Abu-Hamad S, Shoshan-Barmatz V. In self-defence: hexokinase promotes voltage-dependent anion channel closure and prevents mitochondria-mediated apoptotic cell death. Biochem J. 2004;377:347–355. - PMC - PubMed
    1. Ballatori N, Cohen JJ. Intracellular distribution of hexokinase in the tissue zones of rat kidney. Biochim Biophys Acta. 1981;657:448–456. - PubMed
    1. Vandewalle A, Wirthensohn G, Heidrich HG, Guder WG. Distribution of hexokinase and phosphoenolpyruvate carboxykinase along the rabbit nephron. Am J Physiol. 1981;240:F492–500. - PubMed

Publication types

MeSH terms