A survey: Precepts and practices in drug use indicators at Government Healthcare Facilities: A Hospital-based prospective analysis
- PMID: 21430968
- PMCID: PMC3053516
- DOI: 10.4103/0975-7406.76502
A survey: Precepts and practices in drug use indicators at Government Healthcare Facilities: A Hospital-based prospective analysis
Abstract
Background: We planned to identify the difficulties in practicing the rational use of medicine in health facilities, using drug-use indicators.
Materials and methods: We studied the average consultation time (ACT), average number of drugs per encounter (ANDE), percentage of drugs by generic name (PDPG), percentage of encounters with antibiotics (PAP), percentage of encounters with injection (PIP), percentage of drugs prescribed from the essential drugs list (PEDL), using pretested questionnaires in different hospital types.
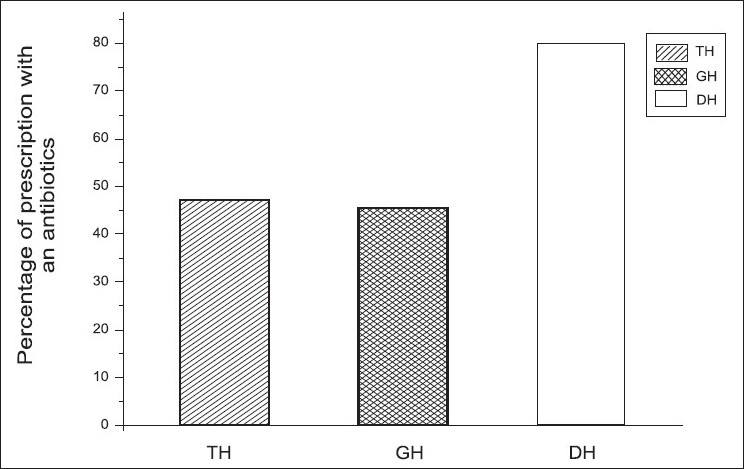
Results: There was a higher value of ACT in Teachin hospital (TH,2.31 min) and general hospital (GH,2.17 min) compared to district hospital (DH,0.83 min). ANDE was high in all three categories (3.24, 2.88, and 3.26 in TH, GH, and DH, respectively). There was a significant difference in ANDE in all three categories (P≤0.05). There was no significant difference in the PDPG among all categories of Hospitals. PAP was highest in DH (80%) and lowest in GH (46%). PIP was highest in DH (6%), 4% in GH, and lowest in TH (3%) in the Galle district. PEDL in TH, GH, and DH were 97, 100, and 99%, respectively. Prescribers use a short consultation time and practice polypharmacy, and the use of generic and essential drug lists is significantly high. Antibiotic usage is high, but usage of injections is low. We further noted prescriptions with absence of the diagnosis, sex, and prescriber's identity.
Conclusion: : We conclude that some areas like polypharmacy, high usage of antibiotics, and poor prescription writing practices are high and they can be addressed by in-service awareness programs for noted prescriber errors.
Keywords: Drug use pattern; essential drug list; polypharmacy; prescriber errors; rational prescription.
Conflict of interest statement
Figures


Similar articles
-
Prospective encounter study of the degree of adherence to patient care indicators related to drug dispensing in Health Care facilities: A Sri Lankan perspective.J Pharm Bioallied Sci. 2011 Apr;3(2):298-301. doi: 10.4103/0975-7406.80769. J Pharm Bioallied Sci. 2011. PMID: 21687362 Free PMC article.
-
Assessment of prescription pattern and prescription error in outpatient Department at Tertiary Care District Hospital, Central Nepal.J Pharm Policy Pract. 2019 Jul 10;12:16. doi: 10.1186/s40545-019-0177-y. eCollection 2019. J Pharm Policy Pract. 2019. PMID: 31321037 Free PMC article.
-
Drug use pattern using WHO core drug use indicators in public health centers of Dessie, North-East Ethiopia.BMC Med Inform Decis Mak. 2021 Jun 25;21(1):197. doi: 10.1186/s12911-021-01530-w. BMC Med Inform Decis Mak. 2021. PMID: 34172067 Free PMC article.
-
Rational Drug Use Evaluation Based on World Health Organization Core Drug Use Indicators in Ethiopia: A Systematic Review.Drug Healthc Patient Saf. 2021 Jul 27;13:159-170. doi: 10.2147/DHPS.S311926. eCollection 2021. Drug Healthc Patient Saf. 2021. PMID: 34349565 Free PMC article. Review.
-
Assessment of medicine use among outpatients at healthcare facilities in Ethiopia using the WHO's prescribing indicators with a focus on antibiotics: a systematic review and meta-analysis.J Antimicrob Chemother. 2020 Aug 1;75(8):2044-2058. doi: 10.1093/jac/dkaa124. J Antimicrob Chemother. 2020. PMID: 32437516
Cited by
-
Prescription pattern and its influencing factors in Chinese county hospitals: a retrospective cross-sectional study.PLoS One. 2013 May 10;8(5):e63225. doi: 10.1371/journal.pone.0063225. Print 2013. PLoS One. 2013. PMID: 23675465 Free PMC article.
-
WHO/INRUD Core drug use indicators and commonly prescribed medicines: a National Survey from Sri Lanka.BMC Pharmacol Toxicol. 2021 Oct 28;22(1):67. doi: 10.1186/s40360-021-00535-5. BMC Pharmacol Toxicol. 2021. PMID: 34711271 Free PMC article.
-
Core Prescribing Indicators and the Most Commonly Prescribed Medicines in a Tertiary Health Care Setting in a Developing Country.Adv Pharmacol Pharm Sci. 2021 Jan 29;2021:6625377. doi: 10.1155/2021/6625377. eCollection 2021. Adv Pharmacol Pharm Sci. 2021. PMID: 33564747 Free PMC article.
References
-
- Krishnaswamy K, Kumar BD, Radhaiah G. A drug survey-precepts and practices. Eur J Clin Pharmacol. 1985;29:363–70. - PubMed
-
- Pradhan SC, Shewade DG, Shashindran CH. Drug utilization studies. Natl Med J India. 1998;1:185–9.
-
- Srishyla MV, Krishnamurthy M, Naga Rani MA. Prescription audit in an Indian hospital setting using the DDD (defined daily dose) concept. Indian J Pharmacol. 1994;26:23–8.
-
- Nazima Y, Mirza, Sagun D, Barna G. Prescribing pattern in a pediatric out-patient department in Gujarat A journal of the Bangladesh Pharmacological Society (BDPS) Bangladesh J Pharmacol. 2009;4:39–42.
-
- Biswas NR, Uppal R, Sharma PL. Perinatal prescribing to indoor patients in Nehru Hospital, PGIMER. Chandigarh J Obset Gynaec Indai. 1993;43:907–10.
LinkOut - more resources
Full Text Sources
Research Materials