

Identification of signal bias in the variable flip angle method by linear display of the algebraic Ernst equation
- PMID: 21432900
- PMCID: PMC3193384
- DOI: 10.1002/mrm.22849
Identification of signal bias in the variable flip angle method by linear display of the algebraic Ernst equation
Abstract
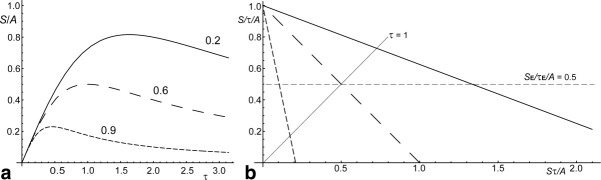
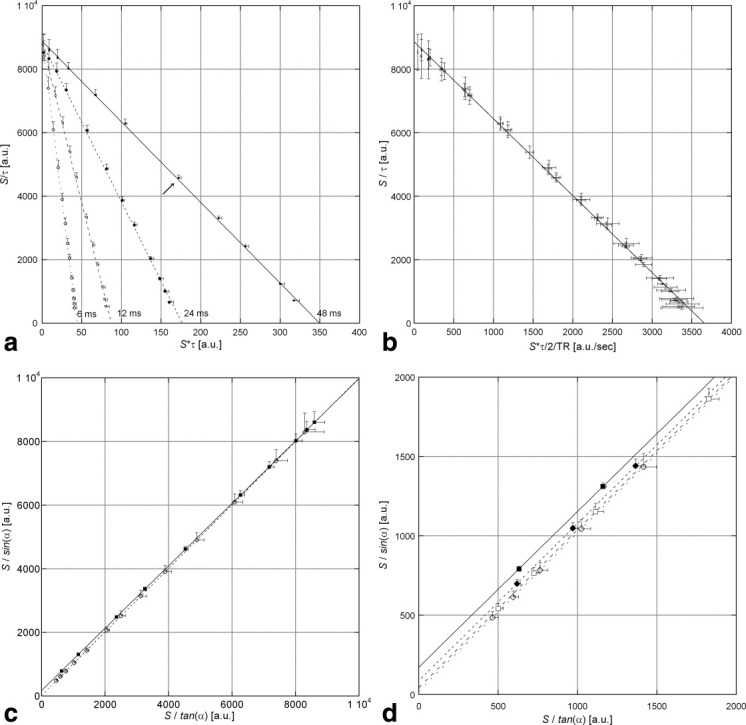
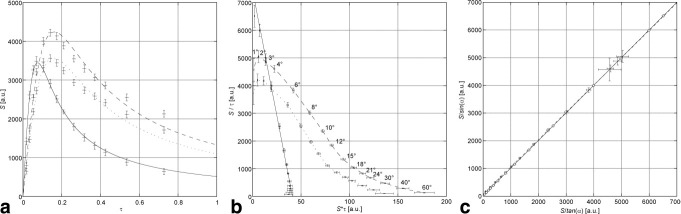
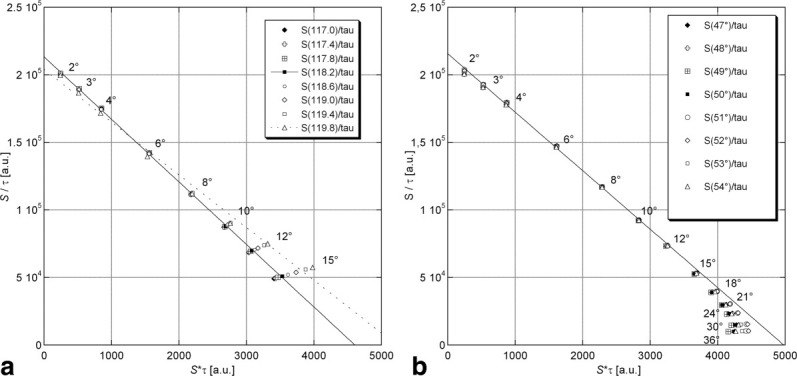
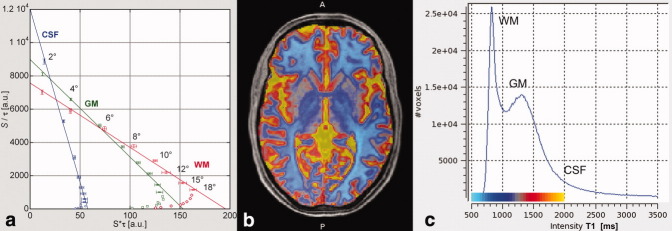
A novel linear parameterization for the variable flip angle method for longitudinal relaxation time T(1) quantification from spoiled steady state MRI is derived from the half angle tangent transform, τ, of the flip angle. Plotting the signal S at coordinates x=Sτ and y=S/τ, respectively, establishes a line that renders signal amplitude and relaxation term separately as y-intercept and slope. This representation allows for estimation of the respective parameter from the experimental data. A comprehensive analysis of noise propagation is performed. Numerical results for efficient optimization of longitudinal relaxation time and proton density mapping experiments are derived. Appropriate scaling allows for a linear presentation of data that are acquired at different short pulse repetition times, TR << T1 thus increasing flexibility in the data acquisition by removing the limitation of a single pulse repetition time. Signal bias, like due to slice-selective excitation or imperfect spoiling, can be readily identified by systematic deviations from the linear plot. The method is illustrated and validated by 3T experiments on phantoms and human brain.
Copyright © 2011 Wiley-Liss, Inc.
Figures
Similar articles
-
T1 mapping with the variable flip angle technique: A simple correction for insufficient spoiling of transverse magnetization.Magn Reson Med. 2018 Jun;79(6):3082-3092. doi: 10.1002/mrm.26979. Epub 2017 Oct 20. Magn Reson Med. 2018. PMID: 29052267
-
Exact algebraization of the signal equation of spoiled gradient echo MRI.Phys Med Biol. 2010 Aug 7;55(15):4231-45. doi: 10.1088/0031-9155/55/15/003. Epub 2010 Jul 8. Phys Med Biol. 2010. PMID: 20616401
-
Rapid assessment of longitudinal relaxation time in materials and tissues with extremely fast signal decay using UTE sequences and the variable flip angle method.Invest Radiol. 2011 Oct;46(10):610-7. doi: 10.1097/RLI.0b013e31821c44cd. Invest Radiol. 2011. PMID: 21577126
-
Tissue sodium concentration and sodium T1 mapping of the human brain at 3 T using a Variable Flip Angle method.Magn Reson Imaging. 2019 May;58:116-124. doi: 10.1016/j.mri.2019.01.015. Epub 2019 Jan 26. Magn Reson Imaging. 2019. PMID: 30695720 Free PMC article.
-
Four-angle method for practical ultra-high-resolution magnetic resonance mapping of brain longitudinal relaxation time and apparent proton density.Magn Reson Imaging. 2020 Feb;66:57-68. doi: 10.1016/j.mri.2019.11.013. Epub 2019 Nov 12. Magn Reson Imaging. 2020. PMID: 31730882 Free PMC article.
Cited by
-
Longitudinal Changes of Quantitative Brain Tissue Properties Induced by Balance Training.Hum Brain Mapp. 2025 Mar;46(4):e70128. doi: 10.1002/hbm.70128. Hum Brain Mapp. 2025. PMID: 40017039 Free PMC article.
-
Multiparameter mapping of relaxation (R1, R2*), proton density and magnetization transfer saturation at 3 T: A multicenter dual-vendor reproducibility and repeatability study.Hum Brain Mapp. 2020 Oct 15;41(15):4232-4247. doi: 10.1002/hbm.25122. Epub 2020 Jul 8. Hum Brain Mapp. 2020. PMID: 32639104 Free PMC article.
-
Whole-Brain Imaging of Subvoxel T1-Diffusion Correlation Spectra in Human Subjects.Front Neurosci. 2021 Jun 11;15:671465. doi: 10.3389/fnins.2021.671465. eCollection 2021. Front Neurosci. 2021. PMID: 34177451 Free PMC article.
-
Multi-site, multi-platform comparison of MRI T1 measurement using the system phantom.PLoS One. 2021 Jun 30;16(6):e0252966. doi: 10.1371/journal.pone.0252966. eCollection 2021. PLoS One. 2021. PMID: 34191819 Free PMC article.
-
Quantitative assessment of subcortical atrophy and iron content in progressive supranuclear palsy and parkinsonian variant of multiple system atrophy.J Neurol. 2013 Aug;260(8):2094-101. doi: 10.1007/s00415-013-6951-x. Epub 2013 May 14. J Neurol. 2013. PMID: 23670309
References
-
- Haase A, Frahm J, Matthaei D, Hänicke W, Merboldt K-D. FLASH imaging: rapid NMR imaging using low flip angle pulses. J Magn Reson. 1986;67:258–266. - PubMed
-
- Buxton RB, Edelman RR, Rosen BR, Wismer GL, Brady TJ. Contrast in rapid MR imaging: T1- and T2-weighted imaging. JCAT. 1986;11:7–16. - PubMed
-
- Helms G, Dechent P. Increased SNR and reduced distortions by averaging multiple gradient echo signals in 3D FLASH imaging of the human brain at 3T. J Magn Reson Imaging. 2009;29:198–204. - PubMed
-
- Christensen KA, Grant DM, Schulman EM, Walling C. Optimal determination of relaxation times of Fourier transform nuclear magnetic resonance. Determination of spin-lattice relaxation times in chemically polarized species. J Phys Chem. 1974;78:1971–1977.
-
- Gupta RK. A new look at the method of variable nutation angle for the measurement of spin-lattice relaxation time using Fourier transform NMR. J Magn Reson. 1977;25:231–235.
Publication types
MeSH terms
Grants and funding
LinkOut - more resources
Full Text Sources
Medical
