. 2011 Apr 20;133(15):5966-75.
doi: 10.1021/ja111131f. Epub 2011 Mar 24.

Quorum sensing between Pseudomonas aeruginosa biofilms accelerates cell growth

Affiliations

Quorum sensing between Pseudomonas aeruginosa biofilms accelerates cell growth

Shane T Flickinger et al. J Am Chem Soc. .

Abstract

This manuscript describes the fabrication of arrays of spatially confined chambers embossed in a layer of poly(ethylene glycol) diacrylate (PEGDA) and their application to studying quorum sensing between communities of Pseudomonas aeruginosa. We hypothesized that biofilms may produce stable chemical signaling gradients in close proximity to surfaces, which influence the growth and development of nearby microcolonies into biofilms. To test this hypothesis, we embossed a layer of PEGDA with 1.5-mm wide chambers in which P. aeruginosa biofilms grew, secreted homoserine lactones (HSLs, small molecule regulators of quorum sensing), and formed spatial and temporal gradients of these compounds. In static growth conditions (i.e., no flow), nascent biofilms secreted N-(3-oxododecanoyl) HSL that formed a gradient in the hydrogel and was detected by P. aeruginosa cells that were ≤8 mm away. Diffusing HSLs increased the growth rate of cells in communities that were <3 mm away from the biofilm, where the concentration of HSL was >1 μM, and had little effect on communities farther away. The HSL gradient had no observable influence on biofilm structure. Surprisingly, 0.1-10 μM of N-(3-oxododecanoyl) HSL had no effect on cell growth in liquid culture. The results suggest that the secretion of HSLs from a biofilm enhances the growth of neighboring cells in contact with surfaces into communities and may influence their composition, organization, and diversity.


Figures
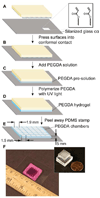
Figure 1
Figure 1
Fabrication of structured PEGDA hydrogels. A) A cartoon of a PDMS stamp with square posts in bas-relief, and a glass cover slip derivatized with a silane presenting a terminal acrylate functional group. B) The PDMS stamp is pressed into conformal contact with the glass cover slip. C) A 15% PEGDA pre-polymer solution is added to the mold, filling the void spaces between the posts of the PDMS stamp. D) Exposure to UV light polymerizes the PEGDA. E) Peeling away the PDMS stamp reveals chambers embossed in a layer of hydrogel where the floor of the chamber is formed by the surface of the glass cover slip. Note that cartoons are not drawn to scale (see critical dimensions on the cartoon). F) An image of an array of 36 chambers (1-mm wide, 5-mm deep) embossed in a layer of 15% PEGDA hydrogel on a glass cover slip. The gel was stained with a red dye to enhance the details of the chambers for the image. Inset: An image of the PDMS stamp used to create the hydrogel.
Figure 2
Figure 2
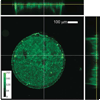
CLSM image of a P. aeruginosa PAO1 biofilm after 72 h growing in a microchamber embossed in a layer of 15% PEGDA hydrogel. The biofilm was stained with FM 4–64 membrane dye. White dashed lines indicate the relative x or y coordinates of the orthogonal views, and the yellow line shows the coordinate along the z-axis.
Figure 3
Figure 3
Structures of N-acyl homoserine lactones that regulate quorum sensing in P. aeruginosa.
Figure 4
Figure 4
The PAO-MW1 QS circuit is activated by the diffusion of HSLs produced by wild type PAO1 biofilms growing in adjacent chambers. A) The experimental system consisted of a 6 × 6 array of mesoscale chambers embossed in a 15% PEGDA hydrogel. B) The four center chambers were filled with M8 media and did not contain cells (white squares); the remaining 32 chambers were inoculated with PAO1 from a diluted overnight culture in M8 minimal media (blue squares). C) The gel was incubated for 24 h at 37 °C. The media in the four center chambers was removed and replaced with inoculates of PAO-MW1pUM15 sub-cultured in LB growth media (yellow squares). The hydrogel was incubated for 10 h at 37 °C and imaged to quantify YFP expression. D) A 3D-plot of YFP fluorescence in the 36-chamber array. Only the four center chambers containing PAO-MW1pUM15 expressed YFP activity relative to the outer wells inoculated with PAO1. Inset: Fluorescent image of one of the four center chambers containing PAO-MW1 pUM15. Scale bar = 0.5 mm. E) A plot of the average fluorescent intensity for chambers inoculated with PAO1 or PAO-MW1pUM15. The average fluorescent intensity for the four center chambers containing PAO-MW1 pUM15 was 407.3 ± 43.0; the intensity of the outer wells was 0.0 ± 0.2.
Figure 5
Figure 5
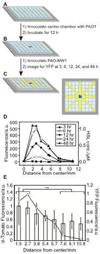
Determining the spatial and temporal influence of diffusible metabolites produced by P. aeruginosa biofilms in proximity to developing P. aeruginosa communities. A) A cartoon of an array of 81 chambers embossed in PEGDA. B) The center chamber was inoculated with PAO1 from a diluted overnight culture in M8 (blue square); the remaining chambers were filled with M8 (white squares). C) The gel was incubated for 12 h at 37 °C and chambers in the cardinal and diagonal directions were inoculated with PAO-MW1 pUM15 (yellow squares) from a diluted overnight culture in LB. The gel was incubated at 37 °C and YFP expression was quantified by imaging after 3, 6, 12, 24, and 48 h. D) A plot of YFP fluorescent intensity in chambers containing PAO-MW1 pUM15 versus their distance (center-to-center) from the center chamber containing PAO1 at different time intervals. E) A plot of d-Tomato fluorescence at 24 h (demonstrating cell density; bar graph) versus chamber distance overlaid with YFP fluorescence at 24 h (demonstrating response to the HSL gradient; open circles) versus chamber distance. Both sets of fluorescence data were normalized. The double asterisks indicates data points that had a p-value < 0.01; p-values are indicated in the text.
Figure 6
Figure 6
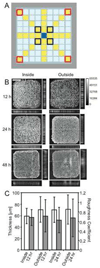
Determining the influence of HSLs produced by wild type P. aeruginosa biofilms on the structure of developing P. aeruginosa biofilms. A) The cartoon depicts an array of 81 microchambers in PEGDA. The center chamber contains wild type PAO1 (blue square), and chambers along the cardinal and diagonal directions contain PAO-MW1 p67T1 (yellow squares). Remaining chambers contained M8 media (light blue squares). B) Three-dimensional reconstructions of biofilms from CLSM images and corresponding orthogonal views of a biofilm in an inside chamber (blue boxes in A) and an outside chamber (red boxes in A). White dashed lines indicate the relative x or y coordinates of the orthogonal views in the 3D reconstructions. Cells were fluorescent and appear white; regions of the structure that are devoid of cells appear dark (e.g. at 12 h). The topography of the biofilm becomes visible at 48 h. C) A plot depicting COMSTAT analysis of biofilm thickness (white bars) and the coefficient of roughness (dark bars) at 12 hr and 24 hr.

References

    1. Costerton JW, Lewandowski Z, Caldwell DE, Korber DR, Lappin-Scott HM. Annu. Rev. Microbiol. 1995;49:711. - PubMed
    1. Donlan Rodney M. Emerg. Infect. Dis. 2002;8:881. - PMC - PubMed
    1. Kjelleberg S, Givskov M, editors. The Biofilm Mode of Life: Mechanisms and Adaptations. 2007.
    1. Lopez D, Vlamakis H, Kolter R. Cold Spring Harbor perspectives in biology. 2010;2:a000398. - PMC - PubMed
    1. Costerton JW, Geesey GG, Cheng KJ. Sci. Am. 1978;238:86. - PubMed

Publication types

MeSH terms