Comparative Study
. 2011 Mar 24:12:160.
doi: 10.1186/1471-2164-12-160.

Comparative transcriptome profiling of amyloid precursor protein family members in the adult cortex

Affiliations
Comparative Study

Comparative transcriptome profiling of amyloid precursor protein family members in the adult cortex

Dorothee Aydin et al. BMC Genomics. .

Abstract

Background: The β-amyloid precursor protein (APP) and the related β-amyloid precursor-like proteins (APLPs) undergo complex proteolytic processing giving rise to several fragments. Whereas it is well established that Aβ accumulation is a central trigger for Alzheimer's disease, the physiological role of APP family members and their diverse proteolytic products is still largely unknown. The secreted APPsα ectodomain has been shown to be involved in neuroprotection and synaptic plasticity. The γ-secretase-generated APP intracellular domain (AICD) functions as a transcriptional regulator in heterologous reporter assays although its role for endogenous gene regulation has remained controversial.

Results: To gain further insight into the molecular changes associated with knockout phenotypes and to elucidate the physiological functions of APP family members including their proposed role as transcriptional regulators, we performed DNA microarray transcriptome profiling of prefrontal cortex of adult wild-type (WT), APP knockout (APP-/-), APLP2 knockout (APLP2-/-) and APPsα knockin mice (APPα/α) expressing solely the secreted APPsα ectodomain. Biological pathways affected by the lack of APP family members included neurogenesis, transcription, and kinase activity. Comparative analysis of transcriptome changes between mutant and wild-type mice, followed by qPCR validation, identified co-regulated gene sets. Interestingly, these included heat shock proteins and plasticity-related genes that were both down-regulated in knockout cortices. In contrast, we failed to detect significant differences in expression of previously proposed AICD target genes including Bace1, Kai1, Gsk3b, p53, Tip60, and Vglut2. Only Egfr was slightly up-regulated in APLP2-/- mice. Comparison of APP-/- and APPα/α with wild-type mice revealed a high proportion of co-regulated genes indicating an important role of the C-terminus for cellular signaling. Finally, comparison of APLP2-/- on different genetic backgrounds revealed that background-related transcriptome changes may dominate over changes due to the knockout of a single gene.

Conclusion: Shared transcriptome profiles corroborated closely related physiological functions of APP family members in the adult central nervous system. As expression of proposed AICD target genes was not altered in adult cortex, this may indicate that these genes are not affected by lack of APP under resting conditions or only in a small subset of cells.


Figures

Figure 1
Figure 1
Overview over study design. (a) Overview of APP processing. APP is first cleaved by either α-secretase or β-secretase, thereby shedding soluble APPsα or APPsβ, respectively. The membrane-bound C-terminal fragments (CTFs) are then cleaved by γ-secretase: αCTF gives rise to p3 and AICD whereas βCTF is cleaved to Aβ and AICD. (b) In APPα/α knock-in mice, a stop codon was introduced behind the α-secretase cleavage site by homologous recombination into the endogenous APP locus. Note that no full length APP or any other fragment can be generated from the APPsα knockin locus. (c) Overview of genotypes used for microarray analysis. APLP2(R1)-/- had been backcrossed for one generation to C57BL/6 whereas WT, APP-/-, APPα/α, APLP2-/- had been backcrossed for six generations. Six pairwise comparisons were performed: WT versus APP-/-, WT versus APPα/α, WT versus APLP2-/-, APPα/α versus APP-/-, WT versus APLP2(R1)-/-, and APLP2-/- versus APLP2(R1)-/-. The arrow indicates reference and tested group of each comparison.
Figure 2
Figure 2
Functional annotation clustering. The five most enriched clusters in the comparisons WT/APP-/-, WT/APPα/α, WT/APLP2-/- including their respective enrichment score are shown. The name of one gene group out of each cluster was taken to represent the complete cluster.
Figure 3
Figure 3
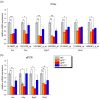
qPCR analysis of indicated target genes. mRNA expression was measured and displayed relative to wild-type level set as one. Values represent means ± SEM of 3 mice/genotype. (Student's t-test: *, p-value < 0.05).
Figure 4
Figure 4
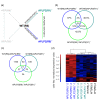
Co-regulation of genes in WT/APP-/- and WT/APLP2-/-. (a) Overview of the analyzed comparisons. (b) Venn diagram of the two comparisons WT/APP-/- and WT/APLP2-/- based on gene lists obtained by significance analysis. The number of significant genes is indicated in the respective segments. Note that 181 genes are co-regulated by the lack of either APP or APLP2. (c) Heatmap of the 213 identifiers corresponding to the set of 181 genes that are co-regulated in both pairwise comparisons. All identifiers show differential expression in the same direction. (d) Heatmap of 122 identifiers corresponding to the set of 97 genes that are found in both pairwise comparisons as well as in WT/APPα/α. The values of the heatmaps (c,d) are normalized expression values with red and blue color representing the number of standard standard deviations above or below the mean expression for each probe set, respectively.
Figure 5
Figure 5
Relative mRNA expression of selected genes co-regulated in all comparisons. (a) Relative mRNA expression obtained by array analysis. Values of indicated probe set identifiers were compared to WT levels. Values represent relative expression value ± relative standard deviation. Differences were tested for significance by SAM (*, q-value < 0.05; **, q-value < 0.01; ***, q-value < 0.001). (b) The corresponding mRNA expression was measured by qPCR and displayed relative to wild-type level set as one. Values represent means ± SEM of 3 animals per group. (Student's t-test: *, p-value < 0.05; **, p-value < 0.01; ***, p-value < 0.001).
Figure 6
Figure 6
Analysis of common genetic profiles in WT/APP-/-, WT/APPα/α and APPα/α/APP-/-. (a) Overview of the analyzed comparisons. (b) Venn diagram with SAM-based gene lists of the three comparisons WT/APP-/-, WT/APPα/α and APPα/α/APP-/-. The numbers indicate the absolute number of differentially expressed genes in the respective comparison. (c) Percentage of probe set identifiers co-regulated in two or three pairwise comparisons. Values are based on the 200 most significantly differentially expressed identifiers for each pairwise comparison. Note that 40% of probe sets are found in the overlap between WT/APP-/- and WT/APPα/α. (d) Heatmap of the probe set identifiers corresponding to the set of 6 genes (b) in the intersection of WT/APPα/α, APPα/α/APP-/-. The values of the heatmap are normalized expression values with red and blue color representing the number of standard standard deviations above or below the mean expression for each probe set, respectively.
Figure 7
Figure 7
Relative mRNA expression of selected genes co-regulated in WT/APP-/- and WT/APPα/α. (a) Relative mRNA expression level obtained by array analysis. Values of indicated probe set identifiers/genes were compared to WT levels. Values represent relative expression value ± relative standard deviation. Differences were tested for significance by SAM (*, q-value < 0.05; **, q-value < 0.01; ***, q-value < 0.001). (b) The corresponding mRNA expression was measured by qPCR and displayed relative to wild-type level set as one. Values represent means ± SEM of 3 animals per group. (Student's t-test: *, p-value < 0.05; **, p-value < 0.01; ***, p-value < 0.001).
Figure 8
Figure 8
Co-regulation of genes in WT(R6)/APLP2(R6)-/-, WT(R6)/APLP2(R1)-/-, APLP2(R6)-/-/APLP2(R1)-/-. (a) Overview of the analyzed comparisons. (b) Percentage of probe set identifiers co-regulated in two or three pairwise comparisons. Values are based on the 200 most significantly differentially expressed identifiers for each pairwise comparison. (c) Venn diagram with SAM-based gene lists of the three comparisons WT(R6)/APLP2(R6)-/-, WT(R6)/APLP2(R1)-/- and APLP2(R6)-/-/APLP2(R1)-/-. (d) Cluster analysis of probe sets corresponding to the set of 27 genes from (c) found exclusively in the comparisons WT(R6)/APLP2(R6)-/- and APLP2(R6)-/-/APLP2(R1)-/-. The values of the heatmap are normalized expression values with red and blue color representing the number of standard standard deviations above or below the mean expression for each probe set, respectively.
Figure 9
Figure 9
Volcano plot of APLP2(R6)-/-/APLP2(R1)-/- and WT(R6)/APLP2(R6)-/-. The absolute value of each probe set identifier's significance score was plotted against the corresponding log2-transformed fold change of (a) APLP2(R6)-/-/APLP2(R1)-/- and (b) WT(R6)/APLP2(R6)-/-. The red line was set arbitrarily to a score value of 6 to highlight the difference between the two Volcano plots. (APLP2-specific data points were removed prior to plotting).
Figure 10
Figure 10
Relative mRNA expression of Ccl21. (a) Array-based analysis of Ccl21 mRNA expression normalized to wild-type level. Values represent relative expression value ± relative standard deviation. Significance was tested by SAM (*, q-value < 0.05; **, q-value < 0.01; ***, q-value < 0.001). (b) qPCR analysis of Ccl21 mRNA expression displayed relative to wild-type level set as one. Values represent means ± SEM. (Student's t-test,*, p-value < 0.05; **, p-value < 0.01; ***, p-value < 0.001).
Figure 11
Figure 11
Analysis of CCL21 protein and Ccl21 mRNA expression. (a) CCL21 protein expression was determined by ELISA in either WT(R6) (n = 3) or APLP2(R6)-/- (n = 4) brain tissue from one hemisphere comprising cortex, hippocampus and olfactory bulb. (b) qPCR analysis of Ccl21 mRNA expression using brain tissue from the contralateral side of the same animals (identical brain regions as in (a). (Student's t-test;*, p-value < 0.05; **, p-value < 0.01; ***, p-value < 0.001).

References

    1. Kimberly WT, Zheng JB, Guenette SY, Selkoe DJ. The intracellular domain of the beta-amyloid precursor protein is stabilized by Fe65 and translocates to the nucleus in a notch-like manner. J Biol Chem. 2001;276:40288–40292. - PubMed
    1. Cao X, Sudhof TC. A transcriptionally [correction of transcriptively] active complex of APP with Fe65 and histone acetyltransferase Tip60. Science. 2001;293:115–120. doi: 10.1126/science.1058783. - DOI - PubMed
    1. Gao Y, Pimplikar SW. The gamma -secretase-cleaved C-terminal fragment of amyloid precursor protein mediates signaling to the nucleus. Proceedings of the National Academy of Sciences of the United States of America. 2001;98:14979–14984. doi: 10.1073/pnas.261463298. - DOI - PMC - PubMed
    1. Scheinfeld MH, Ghersi E, Laky K, Fowlkes BJ, D'Adamio L. Processing of beta-amyloid precursor-like protein-1 and -2 by gamma-secretase regulates transcription. J Biol Chem. 2002;277:44195–44201. doi: 10.1074/jbc.M208110200. - DOI - PubMed
    1. Swistowski A, Zhang Q, Orcholski ME, Crippen D, Vitelli C, Kurakin A, Bredesen DE. Novel mediators of amyloid precursor protein signaling. J Neurosci. 2009;29:15703–15712. doi: 10.1523/JNEUROSCI.4351-09.2009. - DOI - PMC - PubMed

Publication types

Substances