

Selection and quantification of infection endpoints for trials of vaccines against intestinal helminths
- PMID: 21435404
- PMCID: PMC3093614
- DOI: 10.1016/j.vaccine.2011.03.026
Selection and quantification of infection endpoints for trials of vaccines against intestinal helminths
Abstract
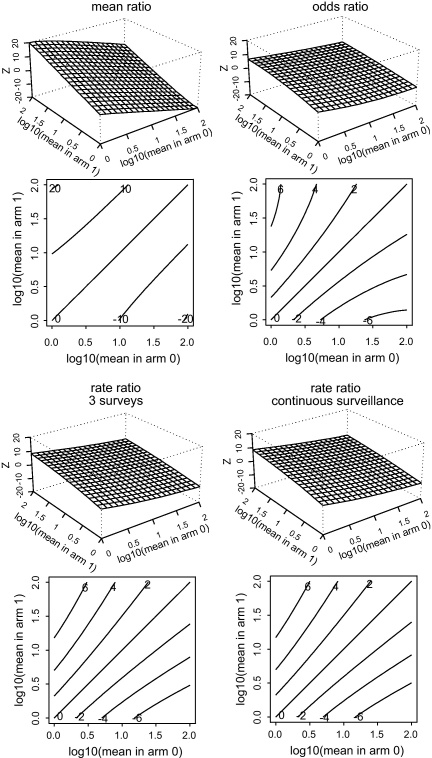
Vaccines against human helminths are being developed but the choice of optimal parasitological endpoints and effect measures to assess their efficacy has received little attention. Assuming negative binomial distributions for the parasite counts, we rank the statistical power of three measures of efficacy: ratio of mean parasite intensity at the end of the trial, the odds ratio of infection at the end of the trial, and the rate ratio of incidence of infection during the trial. We also use a modelling approach to estimate the likely impact of trial interventions on the force of infection, and hence statistical power. We conclude that (1) final mean parasite intensity is a suitable endpoint for later phase vaccine trials, and (2) mass effects of trial interventions are unlikely to appreciably reduce the force of infection in the community - and hence statistical power - unless there is a combination of high vaccine efficacy and a large proportion of the population enrolled.
Copyright © 2011 Elsevier Ltd. All rights reserved.
Figures


Similar articles
-
Comment on: Arithmetic or geometric means of eggs per gram are not appropriate indicators to estimate the impact of control measures in helminth infections.Trans R Soc Trop Med Hyg. 2008 Mar;102(3):297-8; author reply 298. doi: 10.1016/j.trstmh.2007.11.007. Epub 2008 Jan 9. Trans R Soc Trop Med Hyg. 2008. PMID: 18187171 No abstract available.
-
Helminthiasis, bystander diseases and vaccines: analysis of interaction.Trends Parasitol. 2007 Nov;23(11):517-9. doi: 10.1016/j.pt.2007.07.011. Epub 2007 Oct 22. Trends Parasitol. 2007. PMID: 17933584
-
Advances in helminth immunology: optimism for future vaccine design?Trends Parasitol. 2011 Jul;27(7):288-93. doi: 10.1016/j.pt.2011.03.010. Epub 2011 Apr 30. Trends Parasitol. 2011. PMID: 21531626
-
Folic acid supplementation and malaria susceptibility and severity among people taking antifolate antimalarial drugs in endemic areas.Cochrane Database Syst Rev. 2022 Feb 1;2(2022):CD014217. doi: 10.1002/14651858.CD014217. Cochrane Database Syst Rev. 2022. PMID: 36321557 Free PMC article.
-
Vaccination against helminth parasite infections.Expert Rev Vaccines. 2014 Apr;13(4):473-87. doi: 10.1586/14760584.2014.893195. Expert Rev Vaccines. 2014. PMID: 24606541 Review.
Cited by
-
Review: analysis of parasite and other skewed counts.Trop Med Int Health. 2012 Jun;17(6):684-93. doi: 10.1111/j.1365-3156.2012.02987.x. Trop Med Int Health. 2012. PMID: 22943299 Free PMC article. Review.
-
Geographical distribution of soil transmitted helminths and the effects of community type in South Asia and South East Asia - A systematic review.PLoS Negl Trop Dis. 2018 Jan 18;12(1):e0006153. doi: 10.1371/journal.pntd.0006153. eCollection 2018 Jan. PLoS Negl Trop Dis. 2018. PMID: 29346440 Free PMC article.
-
Controlled Human Hookworm Infection: Accelerating Human Hookworm Vaccine Development.Open Forum Infect Dis. 2018 Apr 19;5(5):ofy083. doi: 10.1093/ofid/ofy083. eCollection 2018 May. Open Forum Infect Dis. 2018. PMID: 29780848 Free PMC article.
-
Rates and intensity of re-infection with human helminths after treatment and the influence of individual, household, and environmental factors in a Brazilian community.Parasitology. 2011 Sep;138(11):1406-16. doi: 10.1017/S0031182011001132. Epub 2011 Aug 8. Parasitology. 2011. PMID: 21819640 Free PMC article.
-
A scoping review of transmission models for soil-transmitted helminth infections to underpin the development of a transmission model for Strongyloides stercoralis.Parasitology. 2024 Dec;151(14):1508-1521. doi: 10.1017/S0031182024001392. Parasitology. 2024. PMID: 39545321 Free PMC article.
References
-
- Bethony J., Brooker S., Albonico M., Geiger S.M., Loukas A., Diemert D. Soil-transmitted helminth infections: ascariasis, trichuriasis, and hookworm. Lancet. 2006;367(May (9521)):1521–1532. - PubMed
-
- Horton J. Human gastrointestinal helminth infections: are they now neglected diseases? Trends Parasitol. 2003;19(November (11)):527–531. - PubMed
-
- Gryseels B., Polman K., Clerinx J., Kestens L. Human schistosomiasis. Lancet. 2006;368(September (9541)):1106–1118. - PubMed
-
- Hotez P.J., Bethony J.M., Oliveira S.C., Brindley P.J., Loukas A. Multivalent anthelminthic vaccine to prevent hookworm and schistosomiasis. Expert Rev Vaccines. 2008;7(6):745–752. - PubMed
Publication types
MeSH terms
Substances
Grants and funding
LinkOut - more resources
Full Text Sources
Medical
