

Genome and transcriptome profiles of CD133-positive colorectal cancer cells
- PMID: 21435437
- PMCID: PMC3078450
- DOI: 10.1016/j.ajpath.2010.12.036
Genome and transcriptome profiles of CD133-positive colorectal cancer cells
Abstract
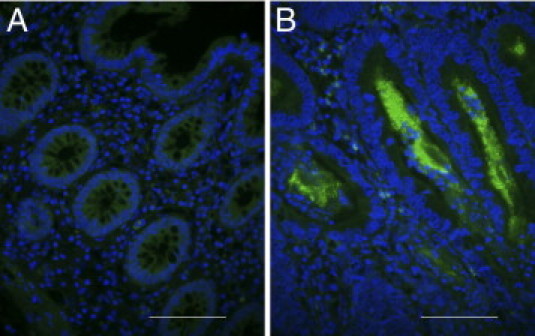
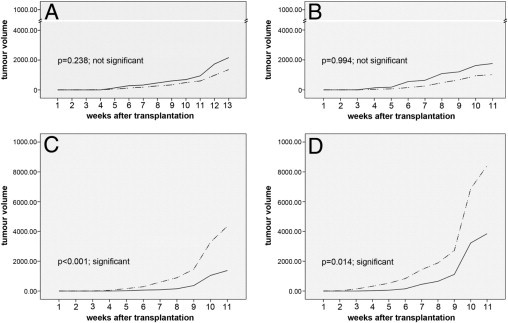
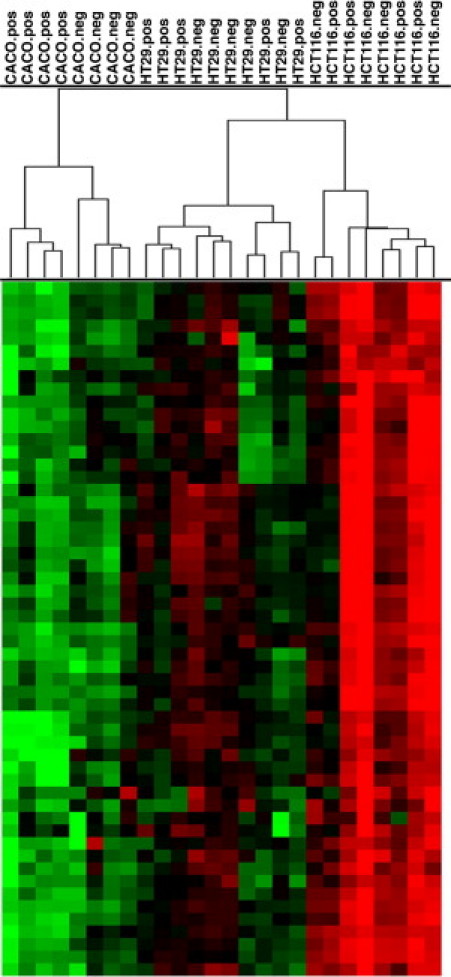
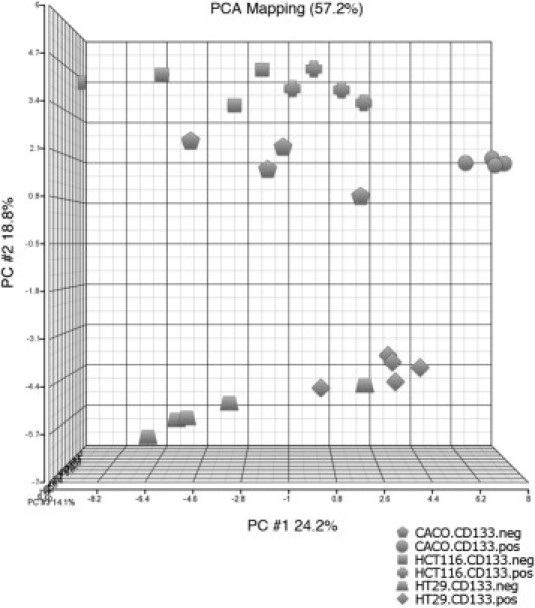
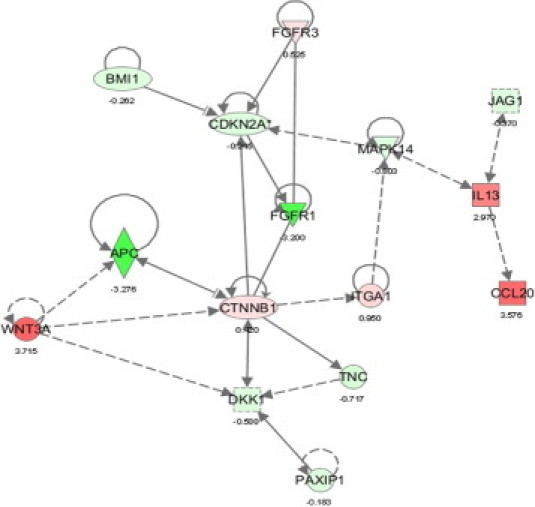
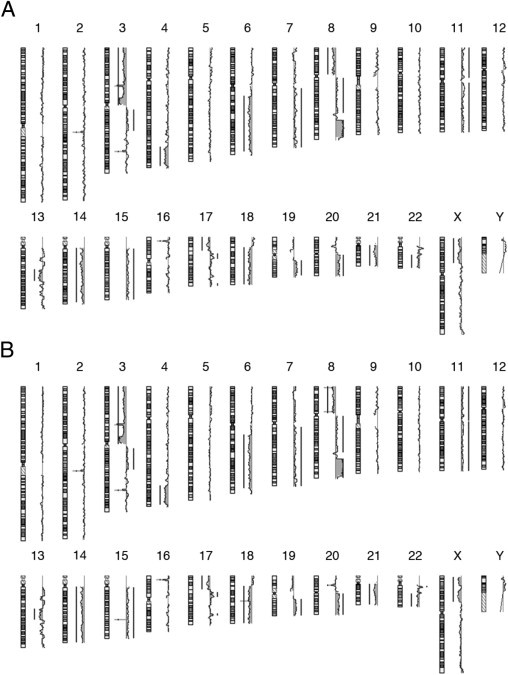
Colorectal carcinomas (CRC) might be organized hierarchically and contain a subpopulation of tumorigenic, putative cancer stem cells that are CD133 positive. We studied the biological and genetic characteristics of such cells in CRC cell lines and primary tumors. Three CRC cell lines were sorted in CD133 positive and negative fractions. The respective genetic aberration profiles were studied using array comparative genomic hybridization (aCGH) and expression profiling. Tumorigenicity for each cellular population was tested by injection into nude mice. Additionally, we compared CD133+ and CD133- cells of 12 primary colorectal tumors using laser capture microdissection and aCGH. Three of five CRC cell lines displayed both CD133+ and CD133- cells, but tumorigenicity of these subfractions did not differ significantly and aCGH revealed essentially identical genomic imbalances. However, 96 genes were differentially expressed between the two populations. Array comparative genomic hybridization analysis after laser capture microdissection of CD133+ and CD133- areas in primary colorectal tumors revealed genetic differences in 7 of 12 cases. The use of cell lines for studying genomic alterations that define cancer stem cell characteristics, therefore, seems questionable. In contrast, CD133+ cells in primary cancer samples showed a unique genomic aberration profile. In conclusion, our data suggest that CD133 positivity defines a genetically distinct cellular compartment in primary CRC, which potentially includes tumor initiating cells.
Copyright © 2011 American Society for Investigative Pathology. Published by Elsevier Inc. All rights reserved.
Figures
References
-
- Hanahan D., Weinberg R.A. The hallmarks of cancer. Cell. 2000;100:57–70. - PubMed
-
- Leslie A., Carey F.A., Pratt N.R., Steele R.J. The colorectal adenoma-carcinoma sequence. Br J Surg. 2002;89:845–860. - PubMed
-
- Habermann J.K., Paulsen U., Roblick U.J., Upender M.B., McShane L.M., Korn E.L., Wangsa D., Kruger S., Duchrow M., Bruch H.P., Auer G., Ried T. Stage-specific alterations of the genome, transcriptome, and proteome during colorectal carcinogenesis. Genes Chromosomes Cancer. 2007;46:10–26. - PubMed
-
- Ried T., Knutzen R., Steinbeck R., Blegen H., Schrock E., Heselmeyer K., du Manoir S., Auer G. Comparative genomic hybridization reveals a specific pattern of chromosomal gains and losses during the genesis of colorectal tumors. Genes Chromosomes Cancer. 1996;15:234–245. - PubMed
-
- Vogelstein B., Fearon E.R., Hamilton S.R., Kern S.E., Preisinger A.C., Leppert M., Nakamura Y., White R., Smits A.M., Bos J.L. Genetic alterations during colorectal-tumor development. N Engl J Med. 1988;319:525–532. - PubMed
MeSH terms
Substances
LinkOut - more resources
Full Text Sources
Medical
Research Materials
