. 2011 Apr;178(4):1676-88.
doi: 10.1016/j.ajpath.2010.12.048.

Expression of prostaglandin E synthases in periodontitis immunolocalization and cellular regulation

Affiliations

Expression of prostaglandin E synthases in periodontitis immunolocalization and cellular regulation

Tove Båge et al. Am J Pathol. 2011 Apr.

Abstract

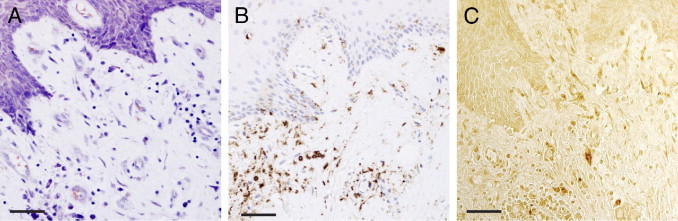
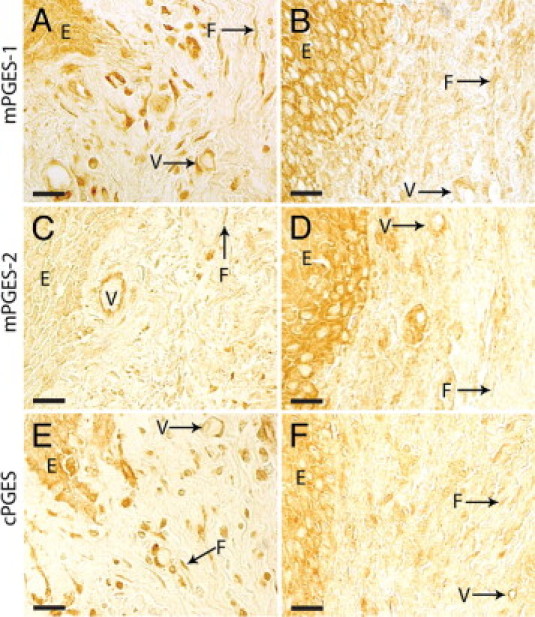
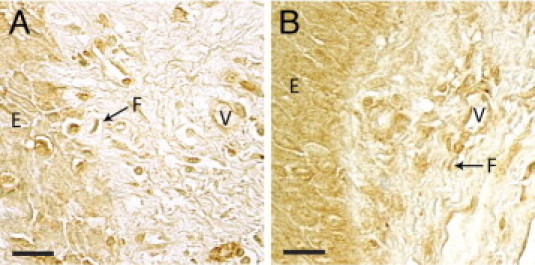
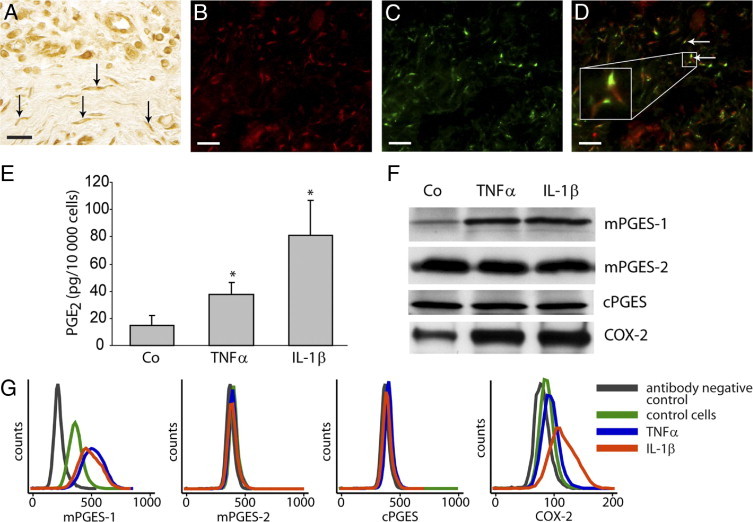
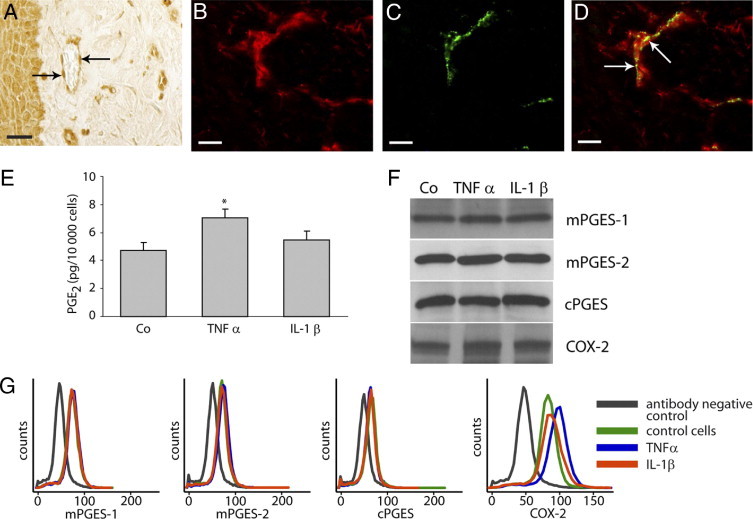
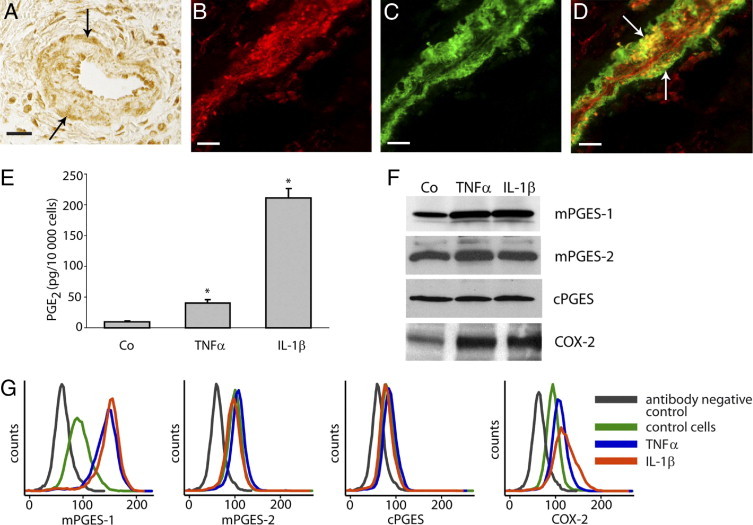
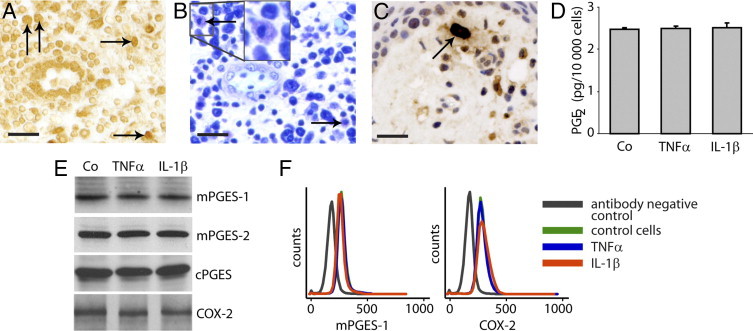
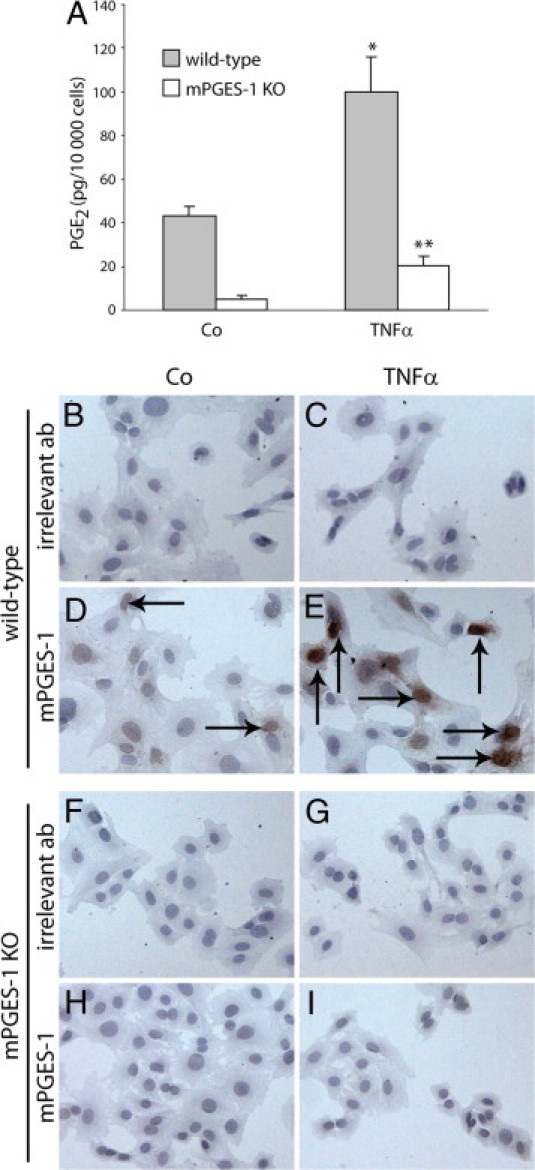
The inflammatory mediator prostaglandin E(2) (PGE(2)) is implicated in the pathogenesis of chronic inflammatory diseases including periodontitis; it is synthesized by cyclooxygenases (COX) and the prostaglandin E synthases mPGES-1, mPGES-2, and cPGES. The distribution of PGES in gingival tissue of patients with periodontitis and the contribution of these enzymes to inflammation-induced PGE(2) synthesis in different cell types was investigated. In gingival biopsies, positive staining for PGES was observed in fibroblasts and endothelial, smooth muscle, epithelial, and immune cells. To further explore the contribution of PGES to inflammation-induced PGE(2) production, in vitro cell culture experiments were performed using fibroblasts and endothelial, smooth muscle, and mast cells. All cell types expressed PGES and COX-2, resulting in basal levels of PGE(2) synthesis. In response to tumor necrosis factor (TNF-α), IL-1β, and cocultured lymphocytes, however, mPGES-1 and COX-2 protein expression increased in fibroblasts and smooth muscle cells, accompanied by increased PGE(2), whereas mPGES-2 and cPGES were unaffected. In endothelial cells, TNF-α increased PGE(2) production only via COX-2 expression, whereas in mast cells the cytokines did not affect PGE(2) enzyme expression or PGE(2) production. Furthermore, PGE(2) production was diminished in gingival fibroblasts derived from mPGES-1 knockout mice, compared with wild-type fibroblasts. These results suggest that fibroblasts and smooth muscle cells are important sources of mPGES-1, which may contribute to increased PGE(2) production in the inflammatory condition periodontitis.


Figures

Figure 1
Figure 1
Contrast staining and immunohistochemical staining of CD45 and IL-1β in gingival tissue of a representative biopsy from a patient with periodontitis. All images are taken from the same area. A: Giemsa contrast staining for tissue morphology. B: CD45 and H&E staining, showing immune cells. C: Immunohistochemical staining for the inflammatory cytokine IL-1β. Scale bars = 50 μm.
Figure 2
Figure 2
Immunohistochemical localization of PGE synthases in gingival tissue from two representative patients with periodontitis, stained against mPGES-1 (A and B), mPGES-2 (C and D), or cPGES (E and F). A, C, and E: One biopsy. B, D, and F: The other biopsy. E, epithelium, F, fibroblast-like cell; V, vessel. Scale bars = 20 μm.
Figure 3
Figure 3
Immunohistochemical localization of COX-2 in gingival tissue from representative biopsies from two different patients (A and B) with periodontitis. E, epithelium, F, fibroblast-like cell; V, vessel. Scale bars = 20 μm.
Figure 4
Figure 4
Production of PGE2 and expression of PGE synthases and COX-2 after treatment with TNF-α (20 ng/mL) or IL-1β (0.5 ng/mL) in gingival fibroblasts. A: Representative immunohistochemical mPGES-1 staining of a gingival biopsy from a patient with periodontitis, showing positively stained fibroblast-like cells (arrows). B: Fluorescent staining of mPGES-1 using Alexa Fluor 594-conjugated secondary antibody (red). C: Fluorescent staining of fibroblasts using fibroblast antibody prolyl-4-hydroxylase (5B5) and Alexa Fluor 488-conjugated secondary antibody (green). D: Merged image of mPGES-1 and prolyl-4-hydroxylase staining showing mPGES-1 expression in fibroblasts (arrows). E:In vitro production of PGE2 in gingival fibroblasts; control cells (Co) 15 ± 7 pg PGE2/10,000 cells, TNF-α-stimulated 38 ± 9 pg PGE2/10,000 cells, and IL-1β-stimulated 81 ± 26 pg PGE2/10,000 cells. *P < 0.05 compared with control cells. F: Expression of PGE synthases and COX-2 in gingival fibroblasts as detected by Western blot. G: Expression of PGE synthases and COX-2 in gingival fibroblasts as analyzed by flow cytometry. All analyses were performed in triplicate. Results shown are representative from at least three independent experiments. Scale bars = 20 μm.
Figure 5
Figure 5
Production of PGE2 and expression of PGE synthases and COX-2 after stimulation with TNF-α (20 ng/mL) or IL-1β (0.5 ng/mL) in HUVECs. A: Representative immunohistochemical mPGES-1 staining of a gingival biopsy, showing positively stained endothelial cells (arrows). B: Fluorescent staining of mPGES-1 using Alexa Fluor 594-conjugated secondary (red). C: Fluorescent staining of endothelial cells using anti-human von Willebrand factor (green). D: Merged image of mPGES-1 and von Willebrand factor staining showing mPGES-1 expression in endothelial cells (arrows). E:In vitro production of PGE2 in HUVECs; control cells (Co) 4.7 ± 0.6 pg PGE2/10,000 cells, TNF-α-treated cells 7.1 ± 0.6 pg PGE2/10,000 cells, and IL-1β-treated cells 5.5 ± 0.6 pg PGE2/10,000 cells. *P < 0.05 compared with control cells. F: Expression of PGE synthases and COX-2 in HUVECs as detected by Western blot. G: Expression of PGE synthases and COX-2 in HUVECs as analyzed by flow cytometry. All analyses were performed in triplicate. Results shown are representative from at least three independent experiments. Scale bars = 20 μm.
Figure 6
Figure 6
Production of PGE2 and expression of PGE synthases and COX-2 after stimulation with TNF-α (20 ng/mL) or IL-1β (0.5 ng/mL) in HASM cells. A: Representative immunohistochemical mPGES-1 staining of a gingival biopsy, showing positive vascular smooth muscle cells (arrows). B: Fluorescent staining of mPGES-1 using Alexa Fluor 594-conjugated secondary antibody (red). C: Fluorescent staining of smooth muscle cells using anti-human smooth muscle actin and Alexa Fluor 488-conjugated secondary antibody (green). D: Merged image of mPGES-1 and smooth muscle actin showing mPGES-1 expression in smooth muscle cells (arrows). E:In vitro production of PGE2 in HASM cells; control cells (Co) 10 ± 0.6 pg PGE2/10,000 cells, TNF-α-stimulated 40 ± 6 pg PGE2/10,000 cells, and IL-1β-stimulated 211 ± 16 pg PGE2/10,000 cells. *P < 0.05 compared with control cells. F: Expression of PGE synthases and COX-2 in HASM cells as detected by Western blot. G: Expression of PGE synthases and COX-2 in HASM cells as analyzed by flow cytometry. All analyses were performed in triplicate. Results shown are representative from at least three independent experiments. Scale bars = 20 μm.
Figure 7
Figure 7
Localization in gingival tissue, with PGE2 production and expression of PGE synthases and COX-2 in cultured cells stimulated with TNF-α (20 ng/mL) or IL-1β (0.5 ng/mL) in human mast cells. A: Representative immunohistochemical mPGES-1 staining of a gingival biopsy, showing positive immune cells (arrows). Toluidine Blue staining (B) and immunostaining using the mast cell marker tryptase (C) of gingival tissues from patients with periodontitis showing the presence of mast cells (arrows). A and B are from the same biopsy, and C is from another. D:In vitro production of PGE2 in the mast cell line HMC-1.2; control cells (Co) 2.5 ± 0.02 pg PGE2/10,000 cells, TNF-α-treated cells 2.5 ± 0.06 pg PGE2/10,000 cells, and IL-1β-treated cells 2.5 ± 0.12 pg PGE2/10,000 cells. E: Expression of PGE synthase and COX-2 in the mast cell line HMC-1.2 as detected by Western blot. F: Expression of mPGES-1 and COX-2 in primary mast cells as detected by flow cytometry. All analyses were performed in triplicate. Results shown are representative from at least three independent experiments. Scale bars = 20 μm.
Figure 8
Figure 8
Production of PGE2 and expression of mPGES-1 in gingival fibroblasts isolated from mPGES-1 knockout (KO) mice and wild-type mice. The cells were treated either with medium alone (control) or with TNF-α (20 ng/mL). A:In vitro production of PGE2 in gingival fibroblasts isolated from mPGES-1 KO and wild-type mice. *P < 0.05 compared with wild-type control cells not treated with TNF-α; **P < 0.05 compared with mPGES-1 KO control cells not treated with TNF-α. D and H: Expression of mPGES-1 in untreated gingival fibroblasts (control cells, Co) derived from wild-type mice and mPGES KO mice, respectively, as detected by immunohistochemistry. E and I: Expression of mPGES-1 in TNF-α stimulated gingival fibroblasts derived from wild-type mice and mPGES-1 KO mice, respectively. B, C, F, and G: Immunohistochemistry staining of the cells with irrelevant polyclonal antibodies (irrelevant ab). Intracellular positive staining is revealed as dark-brown deposit (arrows). Original magnification, ×500 (all images).

References

    1. Pihlstrom B.L., Michalowicz B.S., Johnson N.W. Periodontal diseases. Lancet. 2005;366:1809–1820. - PubMed
    1. Saegusa M., Murakami M., Nakatani Y., Yamakawa K., Katagiri M., Matsuda K., Nakamura K., Kudo I., Kawaguchi H. Contribution of membrane-associated prostaglandin E2 synthase to bone resorption. J Cell Physiol. 2003;197:348–356. - PubMed
    1. Dewhirst F.E., Moss D.E., Offenbacher S., Goodson J.M. Levels of prostaglandin E2, thromboxane, and prostacyclin in periodontal tissues. J Periodontal Res. 1983;18:156–163. - PubMed
    1. Preshaw P.M., Heasman P.A. Prostaglandin E2 concentrations in gingival crevicular fluid: observations in untreated chronic periodontitis. J Clin Periodontol. 2002;29:15–20. - PubMed
    1. Tsai C.C., Hong Y.C., Chen C.C., Wu Y.M. Measurement of prostaglandin E2 and leukotriene B4 in the gingival crevicular fluid. J Dent. 1998;26:97–103. - PubMed

Publication types

MeSH terms