. 2011 Apr;178(4):1814-23.
doi: 10.1016/j.ajpath.2010.12.047.

Nutritional limitation sensitizes mammalian cells to GSK-3β inhibitors and leads to growth impairment

Affiliations

Nutritional limitation sensitizes mammalian cells to GSK-3β inhibitors and leads to growth impairment

Paola de Candia et al. Am J Pathol. 2011 Apr.

Abstract

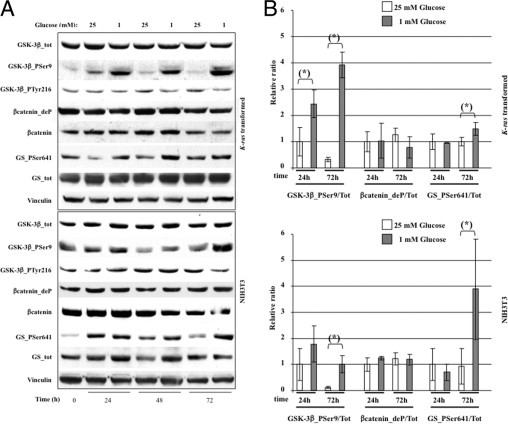
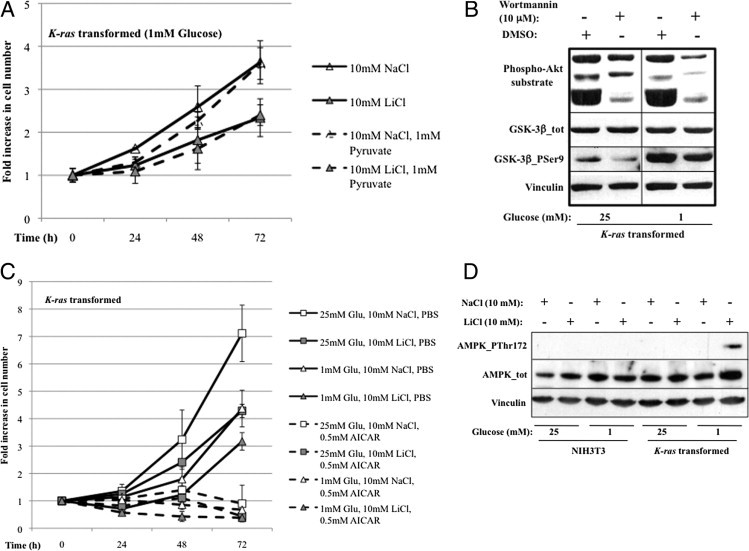
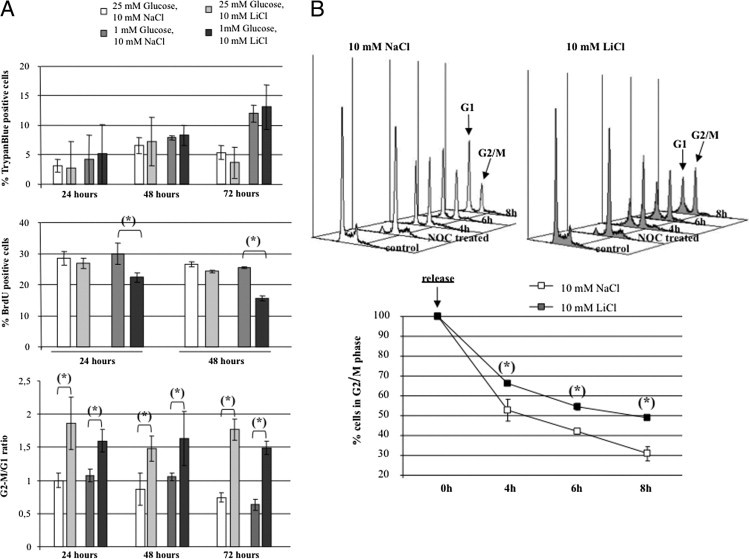
The serine/threonine kinase GSK-3β was initially described as a key enzyme involved in glucose metabolism, but it is now known to regulate a wide range of biological processes, including proliferation and apoptosis. We previously reported a transformation-dependent cell death induced by glucose limitation in K-ras-transformed NIH3T3. To address the mechanism of this phenomenon, we analyzed GSK-3β regulation in these cells in conditions of high versus low glucose availability. We found that glucose depletion caused a marked inhibition of GSK-3β through posttranslational mechanisms and that this inhibition was much less pronounced in normal cells. Further inhibition of GSK-3β with lithium chloride, combined with glucose shortage, caused specific activation of AMP-activated protein kinase and significant suppression of proliferation in transformed but not normal cells. The cooperative effect of lithium and low glucose availability on cell growth did not seem to depend exclusively on ras pathway activation because two human cell lines, A549 and MDA-MB-231, both harboring an activated ras gene, showed very different sensitivity to lithium. These findings thus provide a rationale to further analyze the biochemical bases for combined glucose deprivation and GSK-3β inhibition as a new approach to control transformed cell growth.


Figures

Figure 1
Figure 1
Parental and K-ras–transformed fibroblasts were plated at 3000 cells/cm2 density. After 16 hours of growth, the medium was changed with a glucose concentration maintained at 25 mmol/L (A) and with a glucose concentration of either 25 or 1 mmol/L (B). Cells were harvested after 24 hours (A) or after 24, 48, and 72 hours (B). Total RNA was prepared and was subjected to real-time PCR with oligonucleotides specific to GSK-3β (A) or to GSK-3β and c-src genes (B), as indicated. Each sample was normalized by β-actin internal control. Results are the mean of biological triplicate determinations and were plotted considering the value obtained for parental samples mean (A) or time 0 (B) as equal to 1. For protein expression analysis, normal and transformed cells were plated and grown as described previously herein in 25 mmol/L glucose and were collected at 24 hours. Proteins (50 μg) from total cellular extracts of biological triplicates were subjected to SDS–polyacrylamide gel electrophoresis, followed by Western blotting with an anti–GSK-3β antibody. Relative quantitative values of protein levels after Western blot film acquisition were obtained by densitometric analysis using the ImageJ program and then were plotted considering the densitometric value obtained for the parental samples mean as equal to 1. Error bars represent SD. *P < 0.05 for the t-test.
Figure 2
Figure 2
A:K-ras–transformed and parental fibroblasts were plated at 3000 cells/cm2 density. After 16 hours of growth, the medium was changed with a glucose concentration of either 25 or 1 mmol/L, and cells were harvested at specific time points, as indicated. For protein expression analysis, proteins (50 μg) from total cellular extracts of transformed or normal cells were subjected to SDS–polyacrylamide gel electrophoresis, followed by Western blotting with the indicated antibodies. One of at least three independent experiments is shown. Vinculin was used as a control of equal gel loading. B: Transformed (top) and parental (bottom) cells were plated, grown as described previously herein, and harvested 24 and 72 hours after medium change. Proteins from three independent cellular extracts were subjected to SDS–polyacrylamide gel electrophoresis, followed by Western blotting for the indicated proteins, and then their quantitative values were plotted considering the densitometric value obtained for the sample in 25 mmol/L glucose at 24 hours as equal to 1. Results are the mean of triplicate determinations. Error bars represent SD. *P < 0.05 for the t-test.
Figure 3
Figure 3
K-ras–transformed (A) and parental (B) fibroblasts were plated at 3000 cells/cm2 density in six-well plates. After 16 hours of growth, the medium was changed with those shown. Cells were collected by trypsinization at the indicated times and were counted using a Bürker counting chamber. The fold increase in cell number was plotted considering the cell number at time 0 as equal to 1. The experiment reported is representative of three different ones. Results are the mean of triplicate determinations in a single experiment. Error bars represent SD. DMSO, dimethyl sulfoxide. *P < 0.05 for the t-test.
Figure 4
Figure 4
A:K-ras–transformed cells were plated as described previously herein, and at the time of medium change, to the above media were added either sodium pyruvate or its vehicle, as indicated. Cells were collected by trypsinization at the indicated times and were counted using a Bürker counting chamber. The fold increase in cell number was plotted considering cell number at time 0 as equal to 1. Results are the mean of triplicate determinations in a single experiment. Error bars represent SD. B:K-ras–transformed cells were plated at 3000 cells/cm2 density. After 16 hours of growth, the medium was changed with a glucose concentration of either 25 or 1 mmol/L. At 72 hours of growth, cells were treated with wortmannin, 10 μmol/L [or with dimethyl sulfoxide (DMSO) alone], for 30 minutes and then were harvested. For protein expression analysis, proteins (50 μg) from total cellular extracts were subjected to SDS–polyacrylamide gel electrophoresis, followed by Western blotting with the indicated antibodies. C:K-ras–transformed cells were plated as described previously herein, and at the time of medium change, to the above media were added either aminoimidazole carboxamide ribonucleotide (AICAR) or PBS alone, as indicated. Cells were collected by trypsinization at the indicated times and were counted using a Bürker counting chamber. The fold increase in cell number was plotted considering cell number at time 0 as equal to 1. Results are the mean of triplicate determinations in a single experiment. D:K-ras–transformed and parental fibroblasts were grown in either 25 or 1 mmol/L glucose plus 10 mmol/L NaCl or LiCl, as indicated. Cells were harvested after 72 hours of growth, and for protein expression analysis, proteins (50 μg) from total cellular extracts were subjected to SDS–polyacrylamide gel electrophoresis, followed by Western blotting with the indicated antibodies. Error bars represent SD.
Figure 5
Figure 5
A, top:K-ras–transformed fibroblasts were plated at 3000 cells/cm2 density and were grown on polylysine-precoated glass coverslips. After 16 hours of growth, the medium was changed with those shown. Adherent and floating cells were collected at the indicated time points, and dead cells were evaluated using a trypan blue exclusion assay. Percentage of trypan blue–positive over total cells was plotted as a mean value of biological triplicates. A, center: Transformed cells were plated at 3000 cells/cm2 density in six-well plates. They were treated as described previously herein and then were pulsed 5 hours with BrdU before harvesting at the indicated time points. The cells were analyzed by fluorescence microscopy using an anti-BrdU–specific antibody. The numbers of total and BrdU-positive cells in each condition were counted in 10 nonoverlapping fields per coverslip, and the quantification of BrdU-positive cells per total numbers of DAPI–positive nuclei was determined as a mean percentage taking into account two independent experiments. A, bottom: Transformed cells were plated at 3000 cells/cm2 density in 145-mm plates. They were treated as described previously herein and then were collected at the indicated time points after medium change, stained with propidium iodide, and analyzed using a fluorescence-activated cell sorter. The ratio G2-M/G1 was plotted considering the ratio of cells growing in high glucose at 24 hours as equal to 1. Error bars represent SD. *P < 0.05 for the t-test. B: Transformed cells were plated as described previously herein and were grown in 25 mmol/L glucose for 48 hours. Cells were then treated with nocodazole (NOC), 100 ng/mL, for 16 hours; synchronized cells were released and harvested at the indicated time points. They were then stained with propidium iodide and were analyzed using a fluorescence-activated cell sorter. The experiment reported is representative of three different ones. Results are the mean of triplicate determinations in a single experiment. Error bars represent SD. *P < 0.05 for the t-test.
Figure 6
Figure 6
The A549 (A), MDA-MB-231 (B), and HeLa (C) human neoplastic cell lines were plated at 133,000, 106,000, and 77,000 cells per well, respectively, in six-well plates. After 16 hours of growth, the medium was changed with those shown. Cells were collected by trypsinization at the indicated time points and were counted using a Bürker counting chamber. The fold increase in cell number was plotted considering cell number at time 0 as equal to 1. The experiment was performed in triplicate. Error bars represent SD. *P < 0.05 for the t-test. D: HeLa cells, 1 × 10⁶, were transfected with 10 μg of a porcine cytomegalovirus–transforming K-ras expression vector or with the same amount of a porcine cytomegalovirus empty vector. Twelve hours after transfection, cells were plated in six-well plates (77,000 cells per well) and were grown as described previously herein. Error bars represent SD.

Similar articles

Cited by

References

    1. Kockeritz L., Doble B., Patel S., Woodgett J.R. Glycogen synthase kinase-3: an overview of an over-achieving protein kinase. Curr Drug Targets. 2006;11:1377–1388. - PubMed
    1. Rayasam G.V., Tulasi V.K., Sodhi R., Davis J.A., Ray A. Glycogen synthase kinase 3: more than a namesake. Br J Pharmacol. 2009;156:885–898. - PMC - PubMed
    1. Martinez A. Preclinical efficacy on GSK-3 inhibitors: towards a future generation of powerful drugs. Med Res Rev. 2008;28:773–796. - PubMed
    1. Manoukian A.S., Woodgett J.R. Role of glycogen synthase kinase-3 in cancer: regulation by Wnts and other signaling pathways. Adv Cancer Res. 2002;84:203–229. - PubMed
    1. Polakis P. The oncogenic activation of beta-catenin. Curr Opin Genet Dev. 1999;9:15–21. - PubMed

Publication types