. 2011 Mar 24;69(6):1069-84.
doi: 10.1016/j.neuron.2011.02.018.

Proneural transcription factors regulate different steps of cortical neuron migration through Rnd-mediated inhibition of RhoA signaling

Affiliations

Proneural transcription factors regulate different steps of cortical neuron migration through Rnd-mediated inhibition of RhoA signaling

Emilie Pacary et al. Neuron. .

Abstract

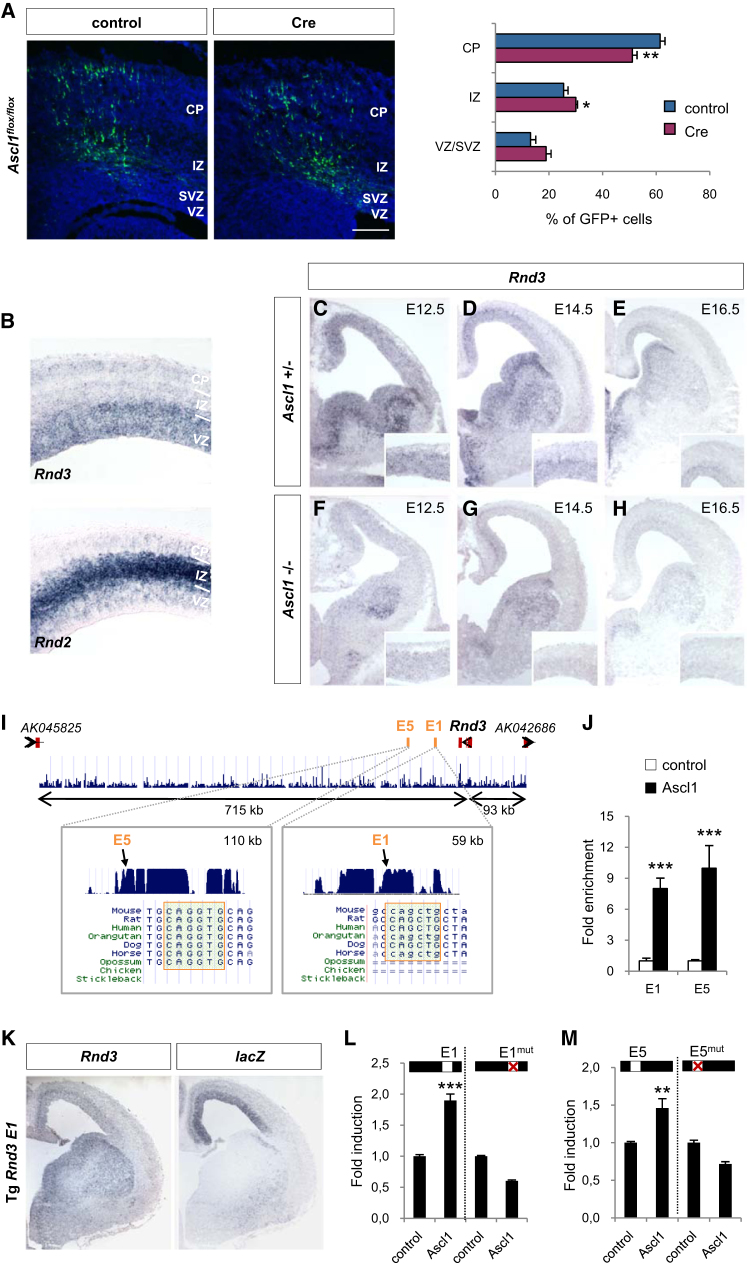
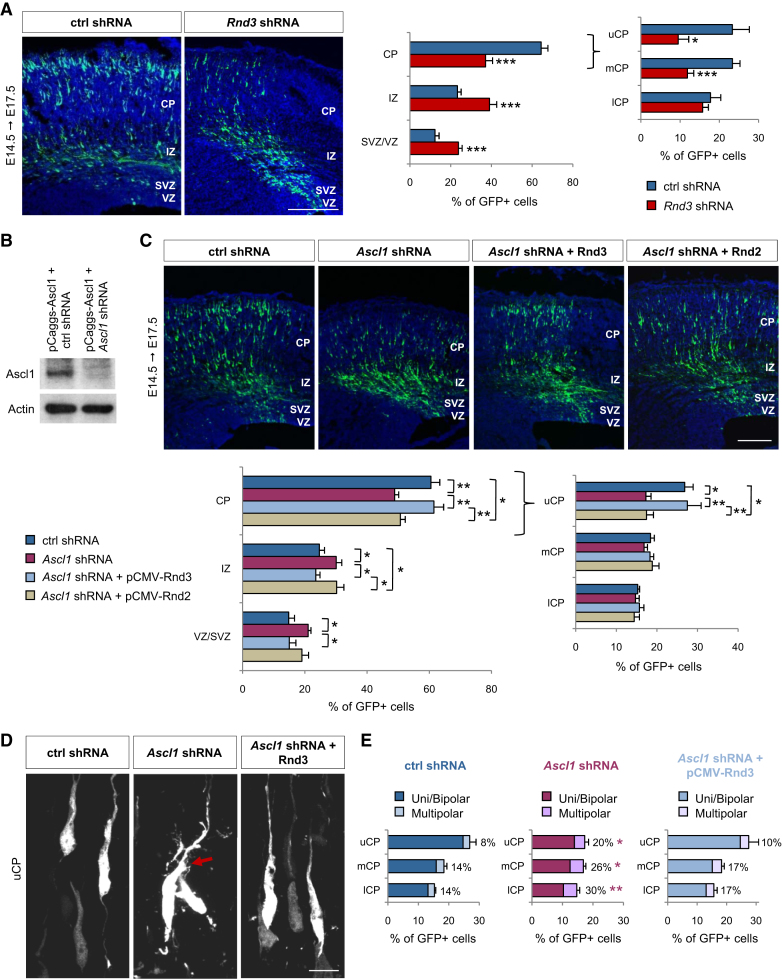
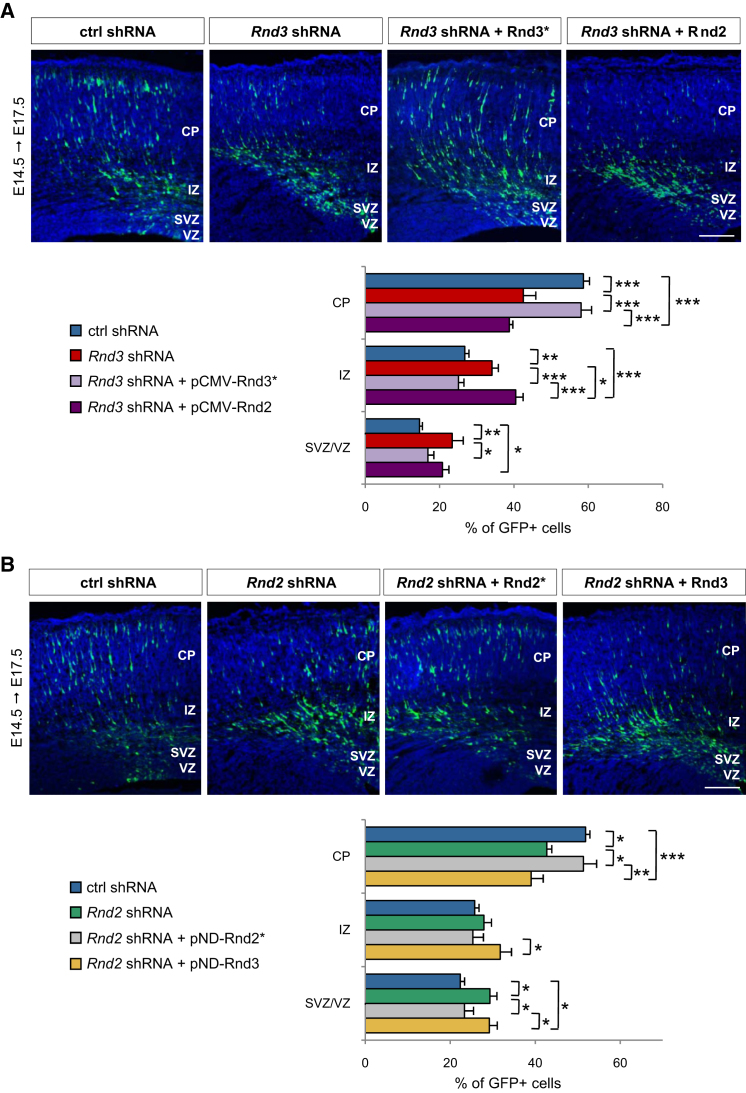
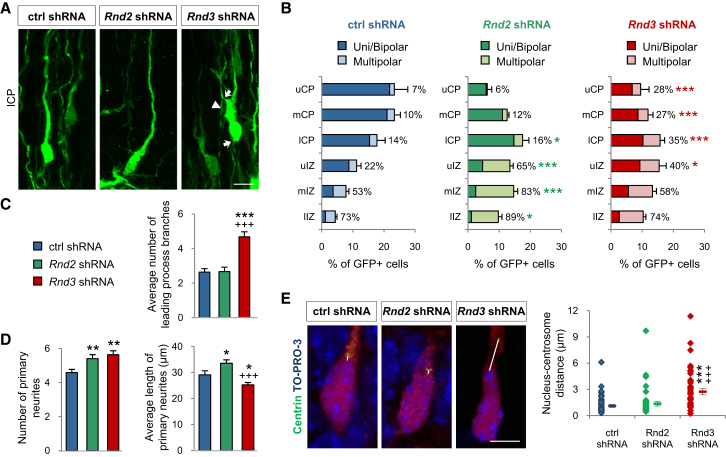
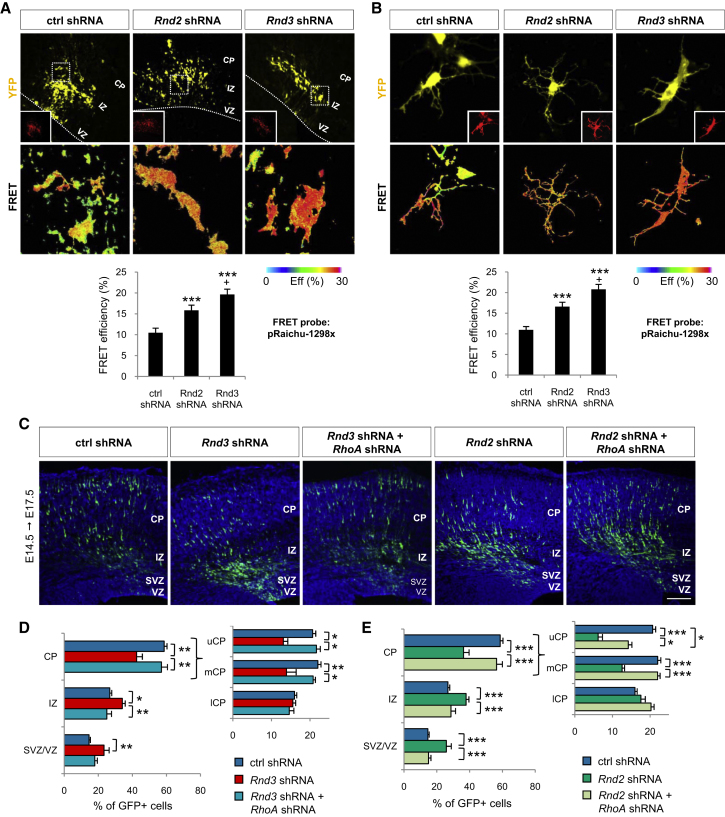
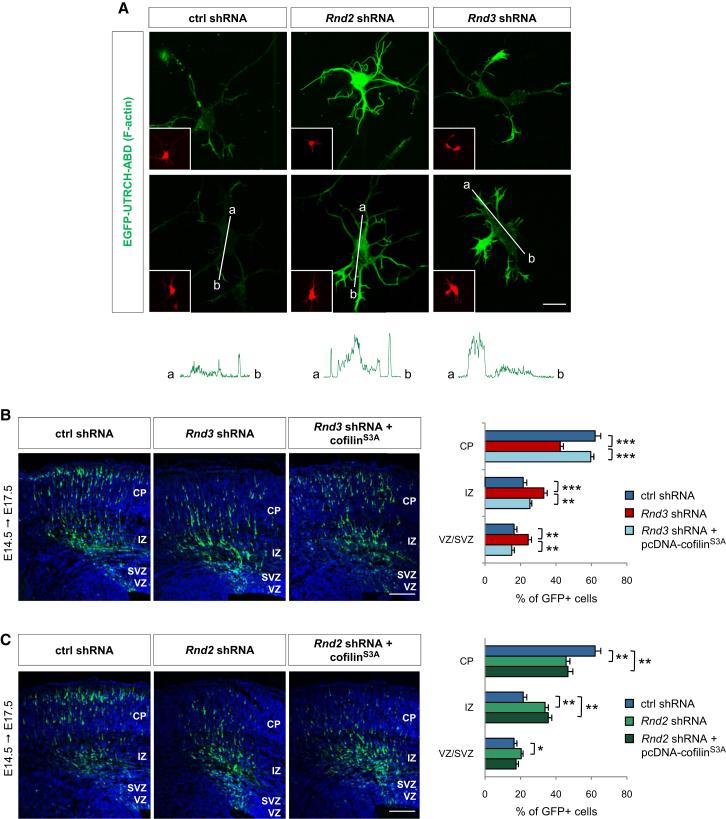
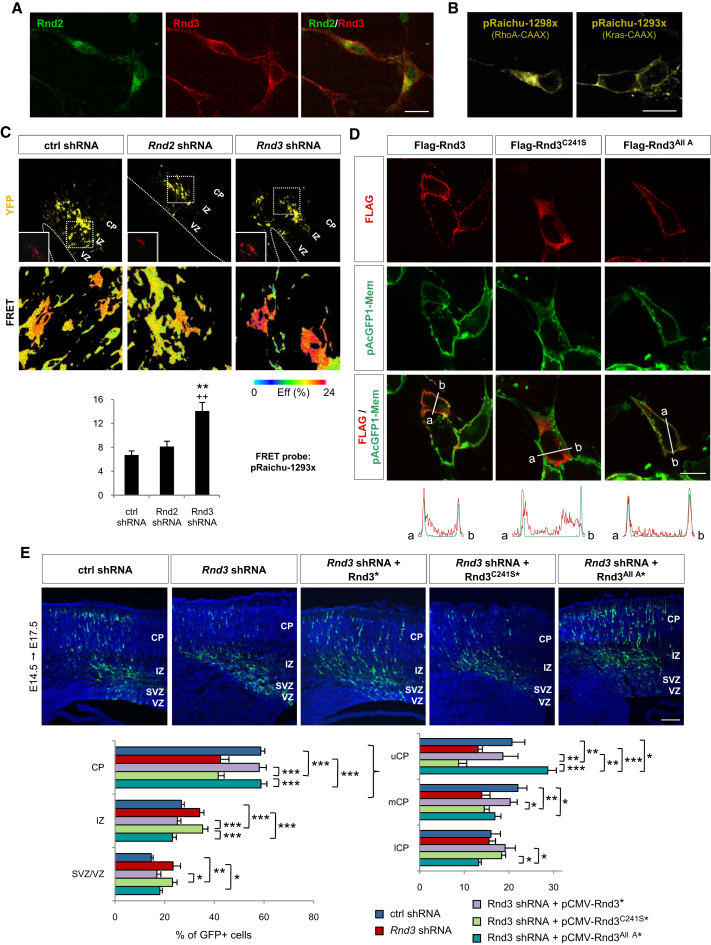
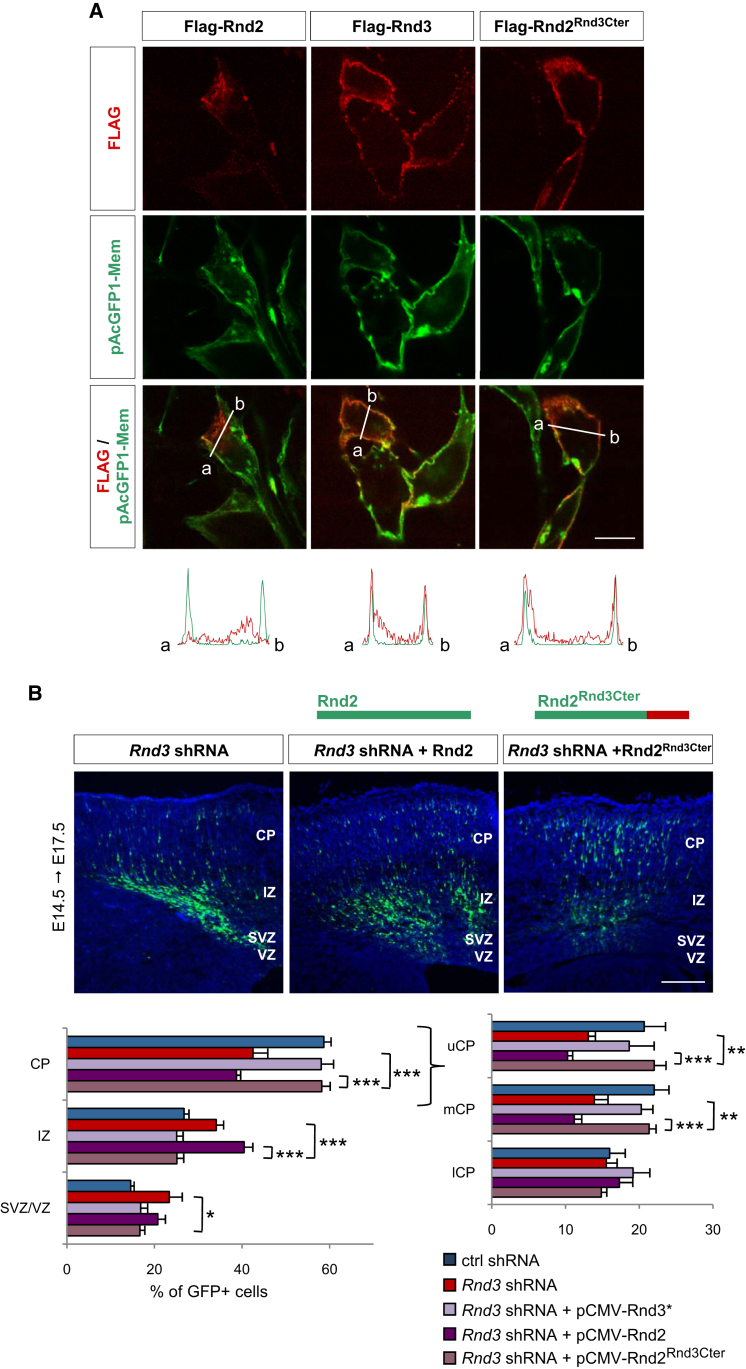
Little is known of the intracellular machinery that controls the motility of newborn neurons. We have previously shown that the proneural protein Neurog2 promotes the migration of nascent cortical neurons by inducing the expression of the atypical Rho GTPase Rnd2. Here, we show that another proneural factor, Ascl1, promotes neuronal migration in the cortex through direct regulation of a second Rnd family member, Rnd3. Both Rnd2 and Rnd3 promote neuronal migration by inhibiting RhoA signaling, but they control distinct steps of the migratory process, multipolar to bipolar transition in the intermediate zone and locomotion in the cortical plate, respectively. Interestingly, these divergent functions directly result from the distinct subcellular distributions of the two Rnd proteins. Because Rnd proteins also regulate progenitor divisions and neurite outgrowth, we propose that proneural factors, through spatiotemporal regulation of Rnd proteins, integrate the process of neuronal migration with other events in the neurogenic program.


Figures

Figure 1
Figure 1
Ascl1 Directly Regulates Rnd3 Expression in the Telencephalon (A) Distribution of electroporated (GFP+) cells in the cerebral cortex of embryos homozygous for a conditional null mutant allele of Ascl1 (Ascl1flox/flox), 3 days after in utero electroporation at E14.5 of a GFP vector (control panel) or GFP and the recombinase Cre (Cre panel). TOTO-3 was used to label nuclei and subdivide the cortical wall into cortical plate (CP), intermediate zone (IZ) and subventricular zone/ventricular zone (SVZ/VZ). The graph presents the quantification of the migration of Ascl1 mutant (Cre- and GFP-electroporated) and control (GFP-electroporated) neurons, performed by measuring the fraction of GFP+ cells that have reached the different zones of the cortex (VZ/SVZ, IZ, CP) 3 days after electroporation. Data are presented as the mean ± SEM from six sections prepared from three embryos obtained from two or three litters. Similar experimental design and quantification were used in subsequent experiments. Student's t test; p < 0.05, ∗∗p < 0.01. Scale bar represents 150 μm. (B) Distribution of Rnd3 and Rnd2 transcripts in the cerebral cortex at E14.5. (C–H) Distribution of Rnd3 transcripts in coronal sections of the developing telencephalon in control (C–E) and Ascl1 null mutant embryos (F–H) at E12.5, E14.5, and E16.5. Cortical expression of Rnd3 is shown at greater magnification in the insets. (I) Two evolutionarily conserved noncoding elements are located 3′ to the Rnd3 gene and contain consensus Ascl1-binding E boxes (E1, 534 bp long and E5, 492 bp long). (J) ChIP by using an antibody against Ascl1 and chromatin prepared from E12.5 ventral telencephalon detected Ascl1 binding to the two Rnd3 3′ elements. For the control experiment, the same procedure was performed without antibody. The mean ± SEM of triplicate quantification from four immunoprecipitations is shown. Student's t test; ∗∗∗p < 0.001. (K) The Rnd3 E1 element cloned upstream of the minimal human β-globin promoter fused to the LacZ reporter gene drove LacZ expression (lacZ panel, analyzed by in situ hybridization) in the dorsal telencephalon of an E14.5 transgenic embryo, in a pattern similar to that of endogenous Rnd3 transcripts (Rnd3 panel). (L and M) Ascl1-activated transcription from the Rnd3 E1 (L) and E5 elements (M) in a luciferase reporter assay in P19 cells. Mutation of the Ascl1 binding motif (E1mut and E5mut) abolished activation of the enhancers by Ascl1. n = 3, mean ± SEM; Student's t test; ∗∗p < 0.01, ∗∗∗p < 0.001. See also Figure S1.
Figure 2
Figure 2
Rnd3 Is a Major Effector of Ascl1 in Neuronal Migration (A) Migration defects of cortical cells electroporated in utero with Rnd3 shRNA at E14.5 and analyzed 3 days later. The graph shows the quantification of the migration of Rnd3 shRNA and control shRNA-electroporated neurons. The CP is further subdivided into upper CP (uCP), median CP (mCP) and lower CP (lCP). Student's t test; p < 0.05, ∗∗∗p < 0.001 compared to control shRNA. (B) Western blot of P19 cells cotransfected as indicated and probed with anti-Ascl1 and anti-actin antibodies to demonstrate the efficiency of Ascl1 silencing by Ascl1 shRNA 2 days after transfection. Expression of actin was used as a loading control. (C) Distribution of cortical cells electroporated with GFP and different constructs as indicated. Ascl1 silencing resulted in radial migration defects that were rescued by overexpression of Rnd3, but not Rnd2. Mean ± SEM; one-way ANOVA followed by a Fisher's PLSD post hoc test; p < 0.05, ∗∗p < 0.01. (D and E) Ascl1-silenced neurons displayed abnormal morphologies. The arrow indicates supernumerary primary processes. Rnd3 overexpression rescued this defect. n > 500 cells from three different brains; Student's t test; p < 0.05, ∗∗p < 0.01 compared to control shRNA. Scale bars represent 150 μm (A, C) and 10 μm (D). See also Figures S2–S4.
Figure 3
Figure 3
Rnd2 and Rnd3 Cannot Replace Each Other in Migrating Neurons (A) The radial migration defect of Rnd3-deficient neurons was rescued by overexpression of a shRNA-resistant version of Rnd3 (Rnd3), but not by overexpression of Rnd2. Mean ± SEM; one-way ANOVA followed by a Fisher's PLSD post hoc test; p < 0.05, ∗∗p < 0.01, ∗∗∗p < 0.001. (B) The migration defect of Rnd2-silenced neurons was rescued by overexpression of Rnd2, but not of Rnd3. Mean ± SEM; one-way ANOVA followed by a Fisher's PLSD post hoc test; p < 0.05, ∗∗p < 0.01, ∗∗∗p < 0.001. Scale bars represent 100 μm (A, B).
Figure 4
Figure 4
Rnd3 and Rnd2 Are Required during Different Phases of Migration (A) Morphology of electroporated cells in the lCP. Rnd3-silenced neurons displayed an enlarged leading process (arrowhead) and multiple thin processes emanating from the cell body and leading process (arrows) not seen in Rnd2-silenced neurons. (B) Quantification of the morphology of electroporated cells in the different zones of the cortex. The percentages represent the proportion of multipolar cells (i.e., cells exhibiting more than two primary processes) in each zone. n > 500 cells from three different brains; Student's t test; p < 0.05, ∗∗∗p < 0.001 compared to control shRNA. (C) Quantification of the number of branches emanating from the leading process. Mean ± SEM; n = 19–21 cells; one-way ANOVA followed by a Fisher's PLSD post hoc test; ∗∗∗p < 0.001 compared to control shRNA; +++p < 0.001 compared to Rnd2 shRNA. (D) Quantification of the number and average length of primary neurites in dissociated cortical neuron cultures established after ex vivo Rnd2 or Rnd3 silencing. Rnd2 and Rnd3 silencing both resulted in an increased number of primary processes in cultured cortical cells, but the processes were significantly longer than normal in Rnd2-silenced neurons and shorter in Rnd3-silenced neurons. The analysis was performed after two DIV by using ImageJ software. Mean ± SEM; n = 53–62 cells; one-way ANOVA followed by a Fisher's PLSD post hoc test; p < 0.05, ∗∗p < 0.01 compared to control shRNA; +++p < 0.001 compared to Rnd2 shRNA. (E) Analysis of the distance between centrosome and nucleus in cortical neurons coelectroporated with shRNA-RFP constructs and pClG2-Centrin2-Venus. The nucleus was labeled with TO-PRO-3. Mean ± SEM; n = 41 cells in all conditions; one-way ANOVA followed by a Fisher's PLSD post hoc test; ∗∗∗p < 0.001 compared to control shRNA; +++p < 0.001 compared to Rnd2 shRNA. Scale bars represent 10 μm (A) and 5 μm (E). See also Figure S3 and Movie S1.
Figure 5
Figure 5
Both Rnd2 and Rnd3 Promote Neuronal Migration by Inhibiting RhoA Activity (A) FRET analysis of RhoA activity in cortical cells in vivo, 1 day after Rnd2 or Rnd3 knockdown. Upper panels show the YFP signal from the FRET probe 1 day after electroporation; the RFP signal in insets marks electroporated cells; lower panels show FRET efficiency in the indicated area. Mean ± SEM; t test, n = 20 cells for each condition; ∗∗∗p < 0.001 compared to control; +p < 0.05 compared to Rnd2 shRNA. (B) FRET analysis of RhoA activity in dissociated cortical cells in culture, 2 days after Rnd2 or Rnd3 knockdown. Mean ± SEM; t test, n = 15 cells for each condition; ∗∗∗p < 0.001 compared to control; +p < 0.05 compared to Rnd2 shRNA. (C–E) Coelectroporation of RhoA shRNA fully rescued the radial migration defects of Rnd3-silenced neurons and partially rescued the radial migration defects of Rnd2-silenced neurons. Mean ± SEM; one-way ANOVA followed by a Fisher's PLSD post hoc test; p < 0.05, ∗∗p < 0.01, ∗∗∗p < 0.001. Scale bar represents 150 μm (C). See also Figures S5 and S6.
Figure 6
Figure 6
Rnd3 and Not Rnd2 Promotes Migration by Depolymerizing F-Actin (A) F-actin visualized with EGFP-UTRCH-ABD probe in dissociated cortical cells 2 days after coelectroporation of the probe and shRNAs. The RFP signals in insets mark electroporated cells. The graphs below the panels show the quantification of the green fluorescence of EGFP-UTRCH-ABD from a to b, as indicated in the panels above, by using ImageJ software. Knockdown of Rnd3 resulted in an accumulation of F-actin in the processes of electroporated cells, while F-actin accumulated in both cell body and processes of Rnd2 knocked-down cells. (B and C) Coelectroporation of cofilinS3A, a nonphosphorylatable form of cofilin that depolymerizes F-actin, fully rescued the migration defects of Rnd3-silenced neurons, but not those of Rnd2-silenced neurons. Mean ± SEM; one-way ANOVA followed by a Fisher's PLSD post hoc test; p < 0.05, ∗∗p < 0.01, ∗∗∗p < 0.001. Scale bars represent 10 μm (A) and 150 μm (B, C).
Figure 7
Figure 7
Rnd3 Activity in Migrating Neurons Requires Its Localization to the Plasma Membrane (A) Distribution of Rnd2 and Rnd3 proteins in cortical neurons harvested at E14.5 and cultured for 2 days. (B) Expression of FRET probes in dissociated cortical neurons, 2 days after electroporation. pRaichu-1298x, which carries the C-terminal region of RhoA including the CAAX box, delivers the probe preferentially to intracellular membrane compartments, whereas pRaichu-1293x, which carries the C terminus of K-Ras, delivers the probe preferentially to the plasma membrane. (C) FRET analysis of RhoA activity in cortical cells in vivo, 1 day after electroporation of pRaichu-1293x together with Rnd2 or Rnd3 shRNA. See Figure 5A for further details. Mean ± SEM; control shRNA, n = 15 cells; Rnd2 shRNA, n = 12 cells; Rnd3 shRNA, n = 16 cells; t test, ∗∗p < 0.01 compared to control; ++p < 0.05 compared to Rnd2 shRNA. (D) Subcellular localization of Flag-Rnd3, Flag-Rnd3C241S and Flag-Rnd3All A cotransfected in HEK293 cells with pAcGFP1-Mem (Clontech) to label the plasma membrane. The graphs below the panels show the quantification of the red fluorescence marking the FLAG-tagged proteins and the green fluorescence of pAcGFP1-Mem from a to b as indicated in the panels above, by using ImageJ software. Flag-Rnd3 is present both at the plasma membrane and in the cytoplasm, Flag-Rnd3C241S is absent from the plasma membrane, and Flag-Rnd3All A is only present at the plasma membrane. (E) Rnd3C241S did not rescue the migration defects of Rnd3-silenced neurons. Coelectroporation of Rnd3All A with Rnd3 shRNA increased the fraction of electroporated cells reaching the upper CP after 3 days compared to coelectroporation of Rnd3. Mean ± SEM; one-way ANOVA followed by a Fisher's PLSD post hoc test; p < 0.05, ∗∗p < 0.01, ∗∗∗p < 0.001. Scale bars represent 10 μm (A, B, D) and 150 μm (E). See also Figure S7.
Figure 8
Figure 8
Rnd3 Function Diverges from that of Rnd2 Because of Its Localization to the Plasma Membrane (A) Subcellular localization of Flag-Rnd2, Flag-Rnd3, and a version of Rnd2 containing the C-terminal end of Rnd3 (Flag-Rnd2Rnd3Cter) transfected in HEK293 cells. Quantification of fluorescence below the panels is as described in Figure 7D. Flag-Rnd3 and Flag-Rnd2Rnd3Cter, but not Flag-Rnd2, colocalize with the plasma membrane. (B) Rnd2Rnd3Cter was as active as wild-type Rnd3 at rescuing the migration defects of Rnd3-silenced neurons, while wild-type Rnd2 had no activity in this assay. Mean ± SEM; one-way ANOVA followed by a Fisher's PLSD post hoc test; p < 0.05, ∗∗p < 0.01, ∗∗∗p < 0.001. Scale bars represent 10 μm (A) and 150 μm (B). See also Figure S8.

Comment in

Similar articles

Cited by

References

    1. Armentano M., Filosa A., Andolfi G., Studer M. COUP-TFI is required for the formation of commissural projections in the forebrain by regulating axonal growth. Development. 2006;133:4151–4162. - PubMed
    1. Bektic J., Pfeil K., Berger A.P., Ramoner R., Pelzer A., Schäfer G., Kofler K., Bartsch G., Klocker H. Small G-protein RhoE is underexpressed in prostate cancer and induces cell cycle arrest and apoptosis. Prostate. 2005;64:332–340. - PubMed
    1. Britz O., Mattar P., Nguyen L., Langevin L.M., Zimmer C., Alam S., Guillemot F., Schuurmans C. A role for proneural genes in the maturation of cortical progenitor cells. Cereb.Cortex. 2006;16(Suppl1 1):i138–i151. - PubMed
    1. Burkel B.M., von Dassow G., Bement W.M. Versatile fluorescent probes for actin filaments based on the actin-binding domain of utrophin. Cell Motil. Cytoskeleton. 2007;64:822–832. - PMC - PubMed
    1. Castro D.S., Skowronska-Krawczyk D., Armant O., Donaldson I.J., Parras C., Hunt C., Critchley J.A., Nguyen L., Gossler A., Göttgens B. Proneural bHLH and Brn proteins coregulate a neurogenic program through cooperative binding to a conserved DNA motif. Dev. Cell. 2006;11:831–844. - PubMed

Publication types

Substances